
An in depth look at one of the most popular ways to analyze price charts and confirm existing setups
Before making their way to the forex market, candlestick patterns had been in use for hundreds of years by Japanese rice farmers. Developed in the 17th century, farmers developed the idea in order to track and speculate on the price of rice in the market. Today, the method of candlestick pattern analysis has evolved to become one of the most commonly used technical analysis tools in the forex market.
The patterns themselves are quite simple and are formed when they display the open, high, low, and closed of a given trading period. The opening to the high is represented by a line, the high to the low represented by a bar, and the low to the close represented by another line. The resulting shape is candlestick, hence the name candlestick patterns.
Why Forex Traders Prefer Candlestick Charts
A large reason why candlestick patterns have gained such great popularity amongst forex traders is because of the relative accuracy they are able to show potential price movements. Depending on which candlestick pattern you decide to examine (there are many and we’ll get to them in just a moment), a candlestick pattern can help you decide which currency pair to buy or sell. When read correctly, they are an incredibly useful and reliable tool in any forex trader’s repertoire.
The Difference Between Bullish and Bearish Candlestick Patterns
Over the years many different candlestick patterns have been sought out and named. We’ll cover individual patterns down below but here we’ll start with bullish patterns. bullish patterns abide by two main principles. First, these patterns need to form within a downturn (if they don’t, they’re merely a continuation pattern). Second, the majority of bullish reversal patterns need bullish confirmation in order to be revealed as such.
Moving in the other direction, just like bullish patterns needing bullish confirmation, bearish patterns require bearish confirmation. Bearish reversal patterns can also form with one or more candlesticks. This reversal points to the fact that selling pressure exceeded buying pressure for a few days.
Let’s take a look at a few examples of bullish and bearish candlestick patterns
Bullish candlestick patterns
Here is a list of bullish candlestick patterns:
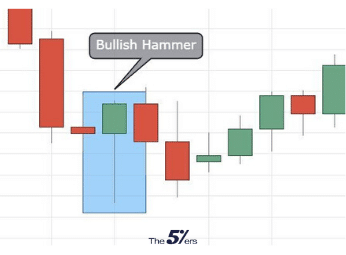
Hammer
As the name suggests, this candlestick resembles a hammer in shape. One of the simplest candlestick patterns, the hammer is made up of one candle with a long lower wick connected to a short body at the top of the candle. A hammer has little to no upper wick. Most traders consider the hammer to be valid once the lower wick is twice as long as the upper part of the candlestick body. The body of the candle must be at the top end of the trading range.
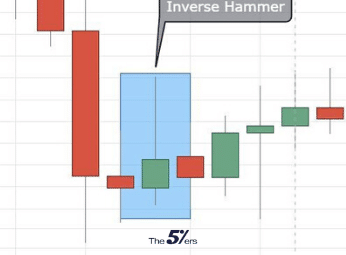
Inverse Hammer
While the hammer candle pattern occurs when a price trades lower than it opened at, the inverted hammer almost always occurs at the bottom of a downtrend. These candles are generally warnings of coming price changes.
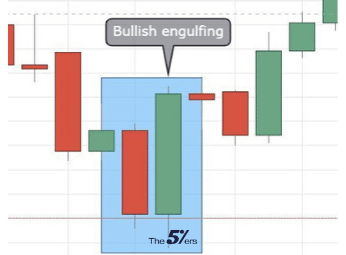
Bullish Engulfing
The first pattern on this list that involves more than one candle, the bullish engulfing pattern is a two candle reversal pattern. After the first dark candle appears, a second larger and hollow one forms and engulfs the body of the first one. This pattern appears in a downward trend and on the second day of the pattern’s appearance, the price opens lower than the day before. However, buying pressure pushes the price up past the previous high which makes the price an eventual win for buyers.
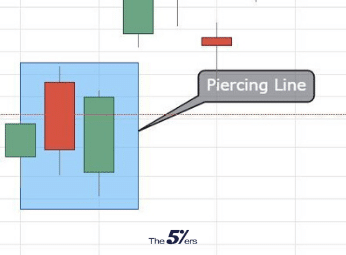
Piercing Line
Another price pattern similar to the bullish engulfing candle, the piercing line is an indication of a potential short-term reversal from a downward trend to an upward trend. The piercing line pattern takes into account a first day opener close to the high and a closing near the low. In between, there is an average trading range. To confirm this pattern, the close must be a candlestick covering at least half of the previous day’s body.
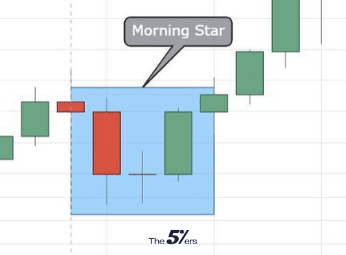
Morning Star
Moving on from two candles to three, the morning star pattern is three candles which follow a downward trend and it is used to indicate the beginning of an upward ascent. This pattern is a precursor to the reversal of the previous price movement.
Three White Soldiers
The three white soldiers is another 3 candlestick pattern which is usually found at the end of a trend. The pattern is formed when 3 long bullish candles appear after a downtrend. This is a signal that a reversal has occurred. This is regarded as one of the most blatant bullish signals you can find in the market.

Bearish Candlestick Patterns
Here is a list of bearish candlestick patterns:
Hanging Man
The first in our set of bearish candlestick patterns, the hanging man pattern appears during an uptrend and is a warning that prices may begin to start falling. The pattern is composed of a real, small body, a long bottom shadow, and a small or no upper shadow. The pattern shows investors that selling interest is increasing. In order to confirm this pattern, the price of the asset must decline.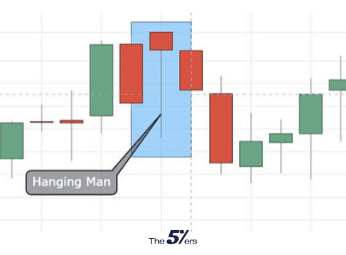
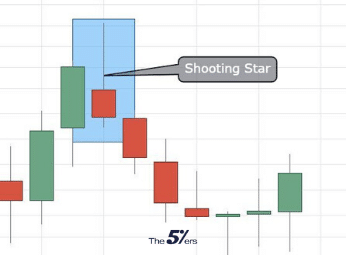
Shooting Star
The shooting star is similar to the hanging man but instead of a long lower shadow, the shooting star has a long upper shadow. It also has a small body but has relatively no lower shadow. This pattern appears when a security opens but doesn’t move far and closes the day in almost the same position as when it opened. To confirm this pattern, the candlestick has to materialize when the price is advancing. The distance from the highest price and the opening price has to be twice that of the candle’s body.
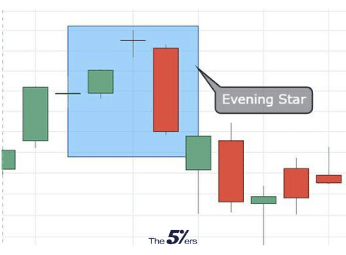
Evening Star
The evening star is a three candle pattern used by investors to signal when a trend is almost ready to reverse. This pattern is most closely associated with the top of a price trend and it signifies that an uptrend is coming to an end. This candlestick pattern is the opposite of the bullish indicator, the morning star.
Bearish Engulfing
A sign of lower prices on the way, the bearish engulfing pattern is made up of an upwards candle being consumed by a larger, downward candle. This candle signifies that sellers have taken over buyers and are aggressively moving prices down. This pattern is the opposite of the bullish engulfing candlestick pattern.

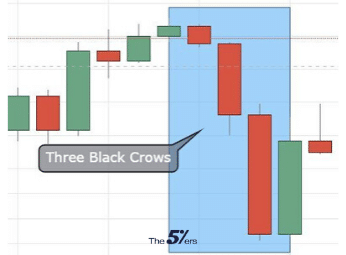
Three Black Crows
Another three candle pattern, the three black crows are a signal that announces the reversal of an uptrend. The opposite of the three white soldiers, the three black crows appear when bearish movements overtake bullish movements over the course of three consecutive trading sessions. The pattern is visualized with three bearish long bodied candles without wicks.

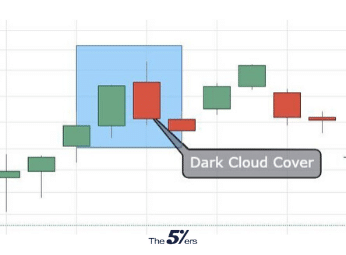
Dark Cloud Cover
Another bearish reversal pattern, the dark cloud cover is when a down candle opens up over the close of the previous up candle. This candle then closes under the middle of the up candle. This pattern indicates a shift in the movement from the upside to the downside.
More Famous Technical Analysis Candlestick Patterns
Here is a list of more famous candlestick patterns
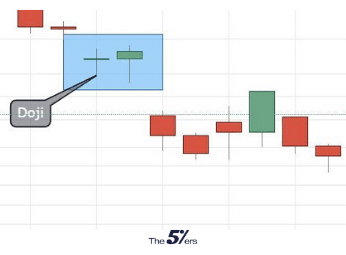
Doji
The Doji candlestick pattern forms when the open and close of a candle is equal. Since it is equal on both ends, the pattern is neutral, hinting that there is general indecision from buyers and sellers. It can take several shapes depending on the length of the shadows meaning it may appear as a cross or a plus sign. This pattern can help to confirm that an important high or low has occurred. It is also used as a signifier that suggests a short term trend reversal might be in progress.
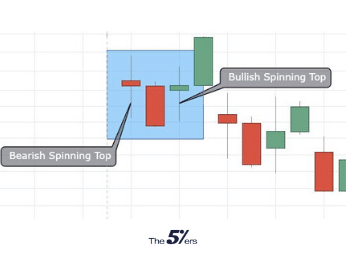
Spinning Top
This candlestick pattern takes the form of a short body which is centered between the top and bottom wicks. This pattern indicates an indecisiveness about which way a price is likely to move in the future. Buyers and sellers are both vying for position and neither has won out. They both pushed the price back and forth but at closing time, the price will settle almost exactly where it opened.
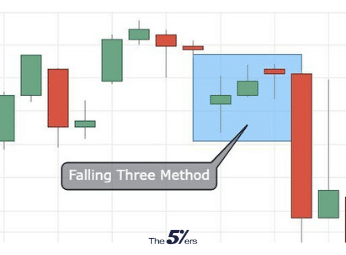
Falling Three Method
This five candles bearish pattern emerges from an ongoing downward trend and tells investors that the bearish period is likely to continue.
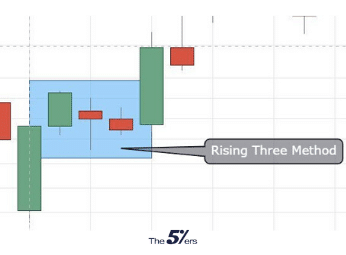
Rising Three Method
As the name suggests, this five candle pattern is the opposite of the falling three method pattern. This candlestick pattern is a signifier that the bullish period is likely to continue.
Forex Candlestick Patterns Bottom Line
Each candlestick pattern mentioned in this article signifies a different movement or action in the market. Forex traders who study these patterns, their shapes, compositions, and meanings for prices can make decisions regarding buying and selling as they see these patterns take shape.
If you’re a visual worker and can see patterns well, reading candlesticks might be a great way for you to trade in the forex market. If recognizing patterns is something you struggle with, candlestick patterns might not be optimal. As with all other tools, it’s necessary to know your strengths and weaknesses in order to match the appropriate systems with your skills.


