
What do Charts and Technical Analysis Patterns Tell Us?
Technical Analysis Price Patterns make strange shapes and outlines in all markets. It may seem weird to the uninitiated that such shapes could have any value, but the fact is that these patterns created by price action on market charts repeat themselves over and over again when certain interactions occur between market forces.
These trading patterns signal those market conditions where a statistical edge exists for a trader to take advantage of.
So, while they are not foolproof, price patterns do provide an edge that can be utilized over the long term, which is how all successful Forex traders make their money and beat the market.
Trendlines in Technical Analysis
Trendlines are straight lines that trace the price movements of the market. An uptrend is defined by higher highs and higher lows.
An uptrend line is drawn below the price levels to show the support levels or is drawn above price levels to show the resistance holding price down.
Downtrends occur when the market makes lower lows and lower highs. Downward trendlines drawn above the prices illustrate the resistance levels.
At least two points must be used to form the line. The more points that fit on the line, the more valid the trendline will typically be found to be.
A sideways market can also be illustrated by two parallel horizontal lines representing both the resistance and support of the range, respectively.
Candlesticks are composed of a part called the body, which represents the opening and close of the price for that period.
Another part of the candle extends above and below the body representing the high and low for that period.
These long, thin projections are called shadows.
Sometimes, a period high or low will coincide with an open or closed, in which case there will be no shadow extending beyond the body.
Some may advocate the drawing of trendlines based on the shadows, but the fact remains that these shadows are outliers, and the price action generally spends most of the time in the body of the candle.
When drawing trendlines, stick to the closing prices of the periods for the most part.
Continuation Trading Patterns
Sometimes, during a trend, the prevailing movement pauses.
There are various logical reasons for this. As a rally continues, long buyers will start selling to take profits, creating selling pressure that drives prices downward.
This selling pressure, combined with buying pressure, creates sideways price action.
Conversely, when a large downward motion will trigger short selling to cover, creating buying pressure to counteract the downward trend. Market conditions occur constantly throughout all markets and create recurring trading patterns in the price chart.
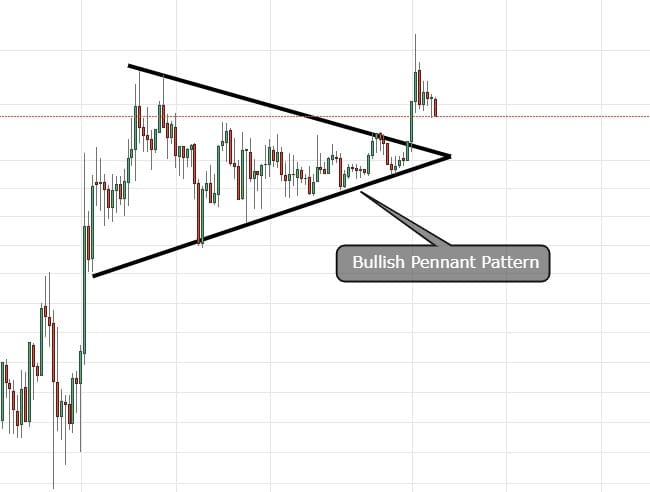
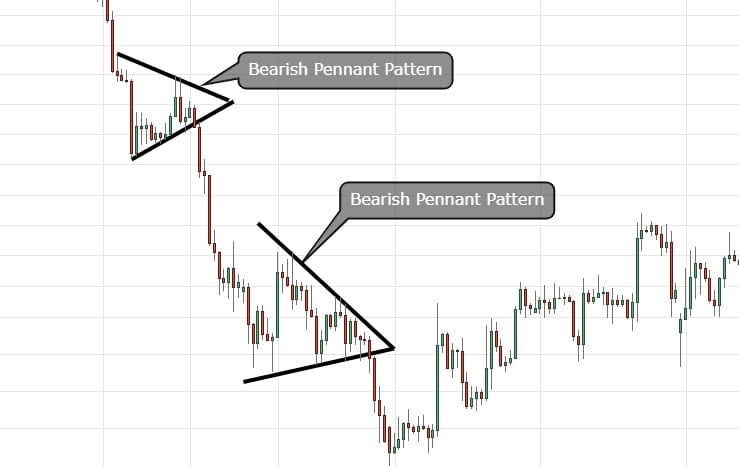
Pennants pattern
A pennant is usually foreshadowed by a sharp rise in price. This almost completely vertical rise in price is called the flagpole or mast.
The two converging trendlines are a downward trendline representing the lower highs and an upward trendline representing the lower lows.
A pennant that follows a sharp downward move will tend to continue downward and be considered a bearish pennant, while a pennant forming after a sharp upward move will be considered a bullish pennant.
Pennants usually appear about halfway through the entire price move, so the move after the pennant is broken will typically be about the same magnitude as the mast.
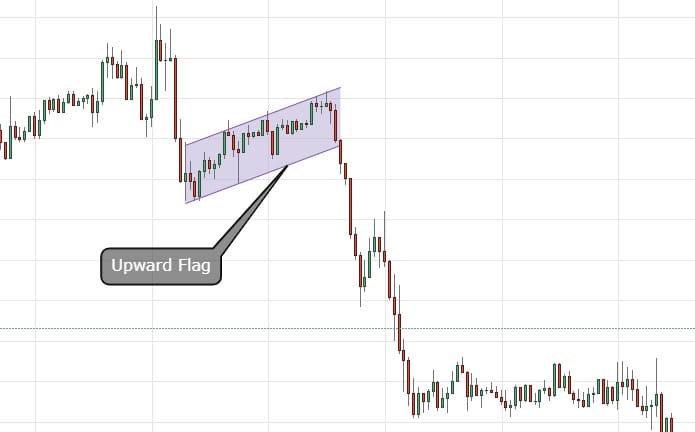
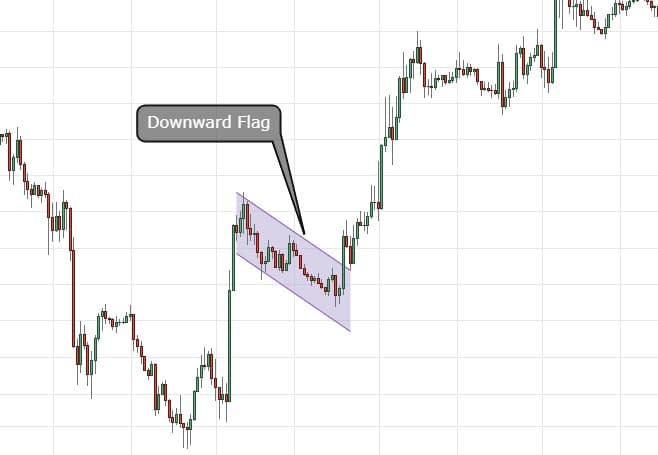
Flags pattern
Flags are composed of parallel trendlines that buck the current larger trend.
These can be upward-trending, downward trending, or sideways. Unlike wedges (mentioned below), the trendlines do not converge.
Flags that slope upwards appear in a downward-trending market, while downward-sloping flags will appear in an upward-trending market.
The trend will tend to continue after the flags have materialized and the price progresses out of the pattern.
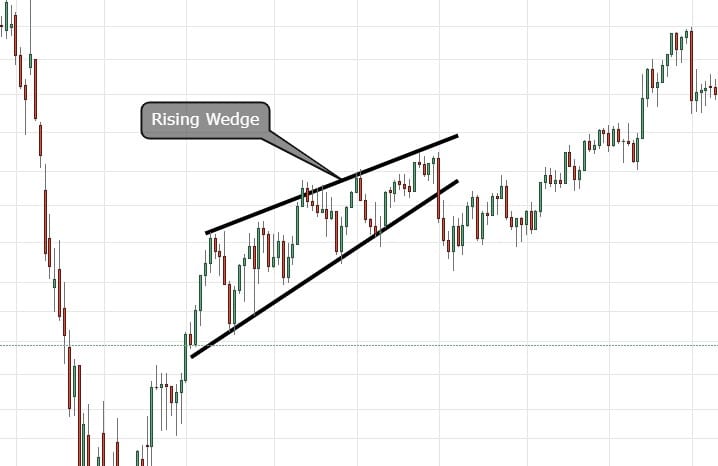
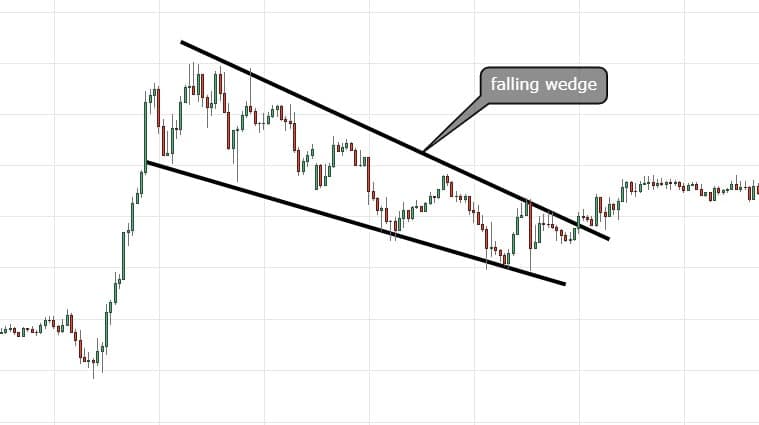
Wedges pattern
In technical analysis patterns, wedges are similar to pennants, except that both trendlines are moving in the same direction.
Rising wedges tend to foreshadow upward breakouts, while falling wedges give rise to both upward and downward breakouts.
This means that, particularly for falling wedges, confirmation should always be obtained before trading the breakout.
Triangles pattern
One common chart pattern is the triangle. We wrote an article on how to trade it, There are three types of triangles:
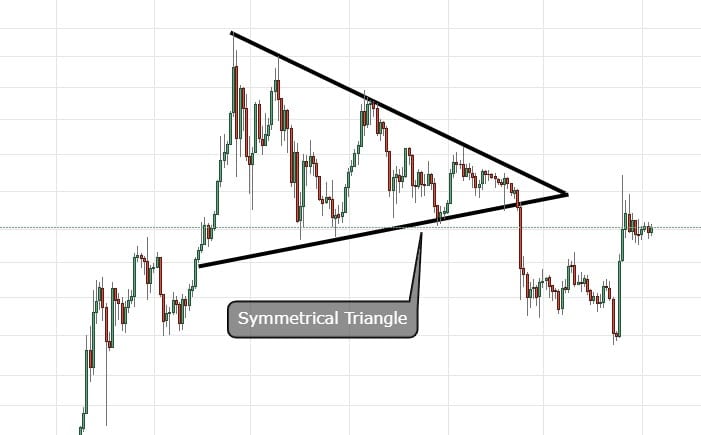
Symmetric Triangles pattern
Symmetric triangles are created when the line connecting the highs converges with the trendline connecting the lows to form a triangle.
those trading patterns are defined by a downward trendline and an upward trendline converging together.
Since both lines of the ascending triangle have essentially the same slope, the direction cannot be predicted.
With any likelihood, a breakout in one direction or the other is likely. But the direction of the triangle is not upward or downward because the slope of both lines more or less mirrors each other.
This pattern suggests that the trend in place before the pattern formed will continue once the price breaks out of the triangle.
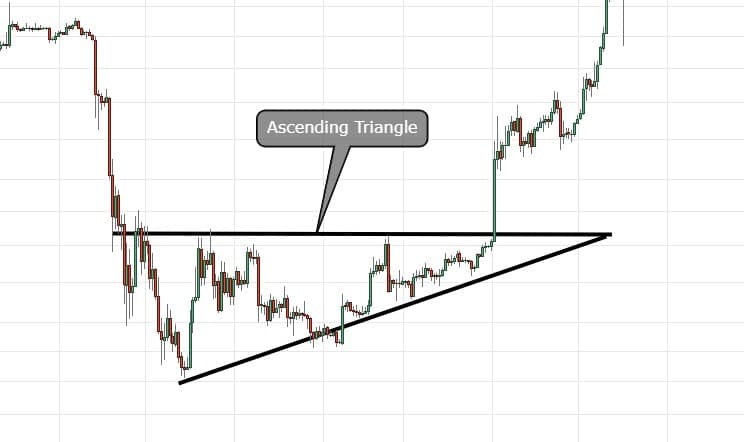
Ascending Triangles pattern
An ascending triangle is formed by a flat line that comes with the highs staying at pretty much that same price and a sharp upwards trendline that comes with the higher lows.
In other words, the highs will stay constant while the lows will rise.
This pattern suggests that buying pressure exceeds selling pressure, which will essentially result in a breakout to the upside.
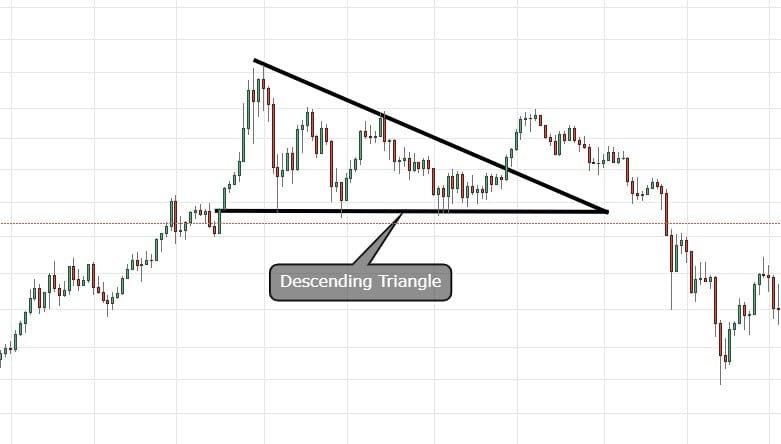
Descending Triangles pattern
Descending triangles are like upside-down ascending triangles. Instead of pointing upward, they point downward.
This pattern is caused by the flatness of the slope of the bottom trendline and the sharper downward slope of the top trendline.
This pattern suggests that sellers are overtaking the buyers and pushing prices downward.
This is a bearish continuation pattern that indicates a breakdown (downward breakout) once the pattern is broken.
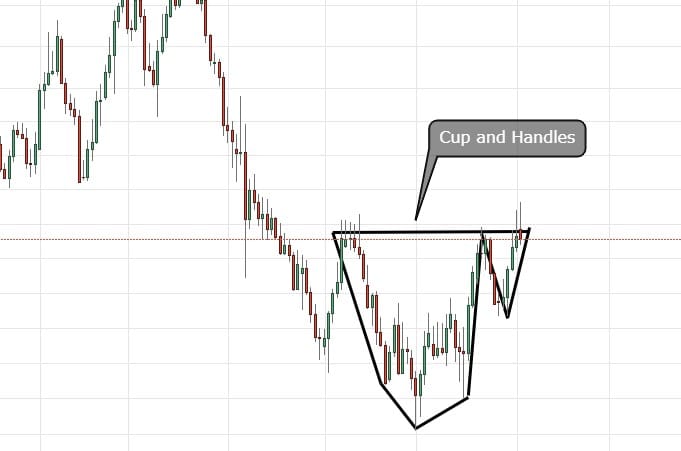
Cup and Handles pattern
A cup and handle pattern is a bullish continuation pattern.
The pattern is defined by a U-shaped cup or bowl, which then transitions into a downward trend, which is called the handle.
Cups with more of a U-shape give a stronger signal, while cups with a pronounced V-shape should be avoided.
The depth of the handle should not exceed beyond half the depth of the cup.
Reversal Patterns
Just as continuation patterns signal the continuation of a trend, reversal patterns signal the reversal of a trend.
While continuation patterns suggest that the market is pausing before another push in the same direction, a reversal pattern foreshadows that the trend has exhausted itself and the market is about to go in the opposite direction.
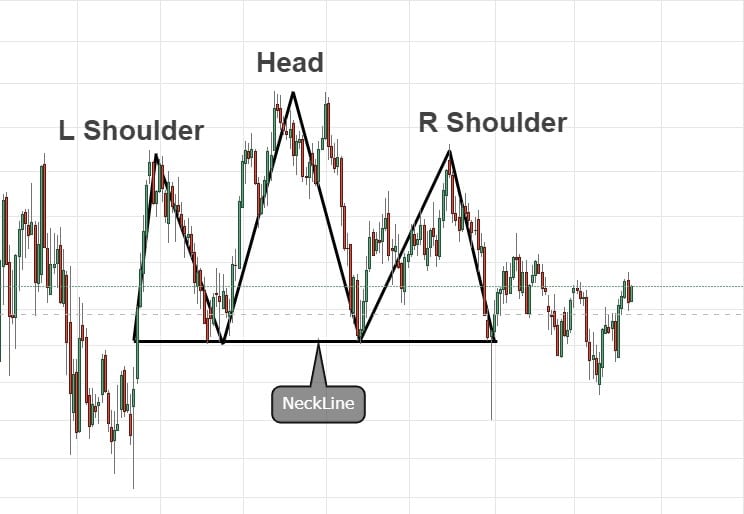
Head and Shoulders pattern
A Head and Shoulders pattern consists of a peak, followed by a larger peak, followed in turn by a peak of a similar size to the first.
This pattern suggests that the market is at the top and will turn in the other direction.
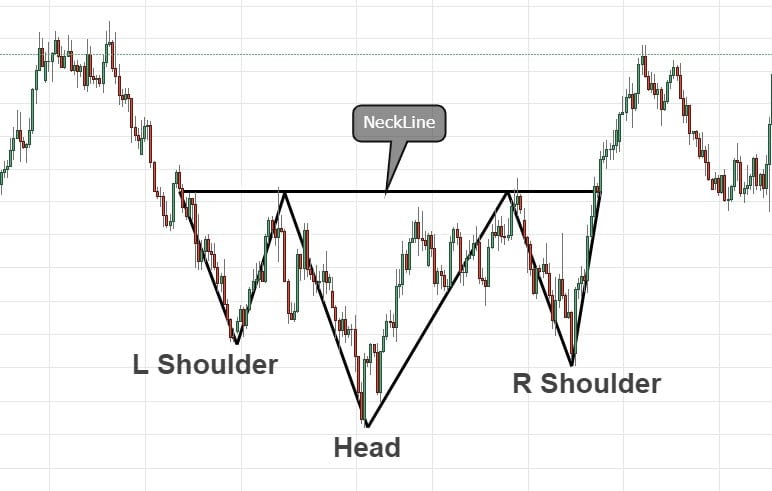
Inverse Head and Shoulders pattern
The inverse head and shoulders pattern is simply an upside-down version of the same pattern.
That is, it is defined by a trough, followed by a bigger trough, which is then followed by a trough of a similar size to that first trough.
This signals that a downtrend is about to turn up.
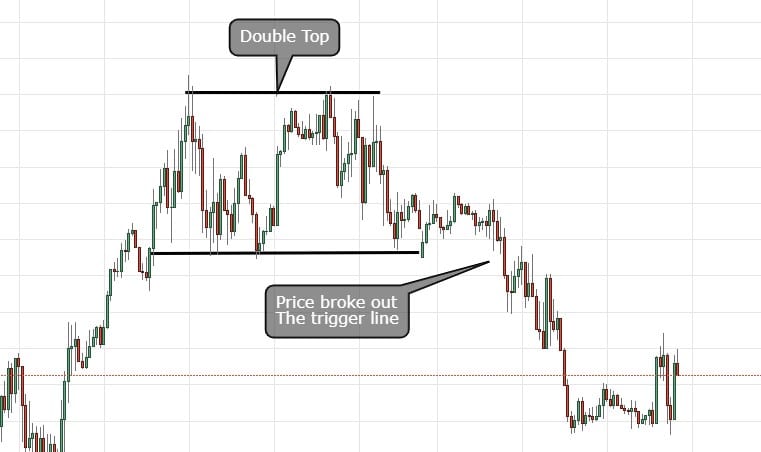
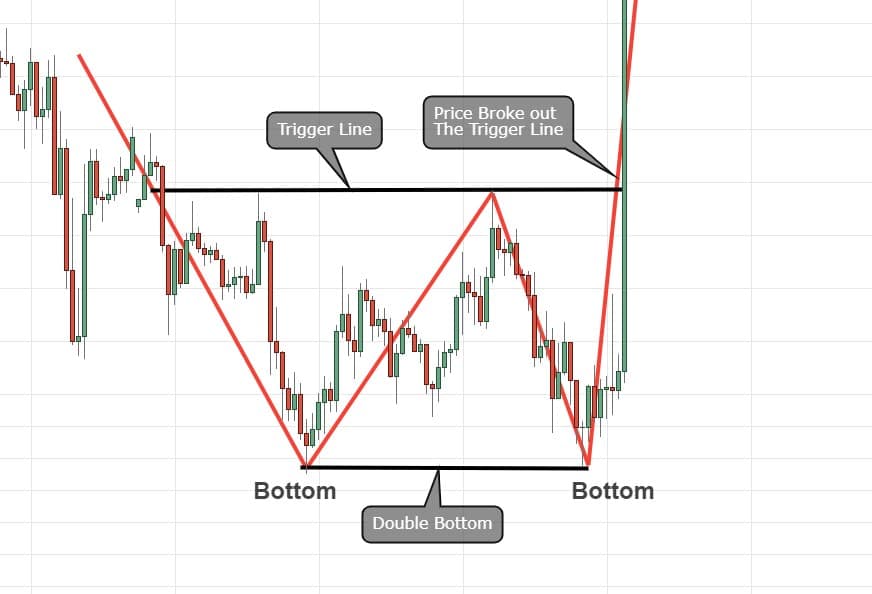
Double Tops and Double Bottoms pattern
Double tops and double bottoms are shaped like Ms and Ws, respectively, and are a sign of price attempting to break through support or resistance and failing to do so.
They suggest that the price is unable to penetrate further and is about to move in the opposite direction.
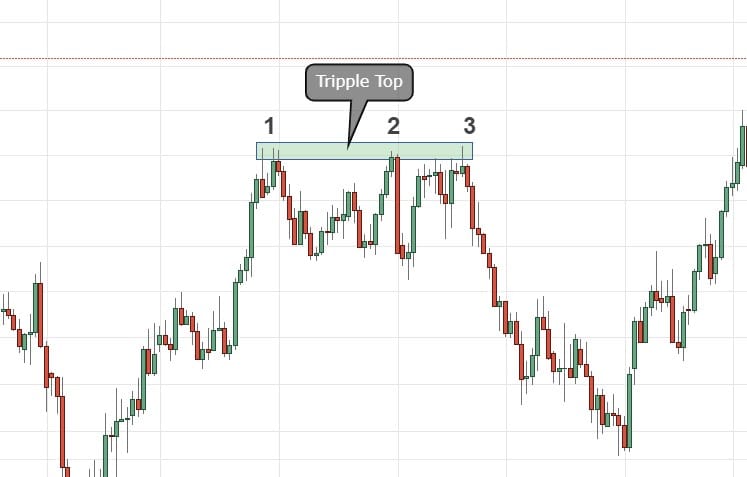
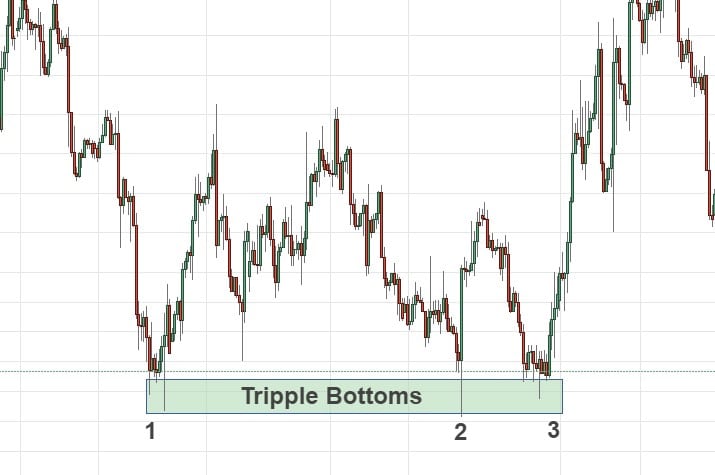
Triple Tops and Triple Bottoms pattern
These are similar concepts to double tops and double bottoms, but even more powerful because the price was denied the breakthrough three times instead of only two.
The more often a support or resistance level holds when being tested, the stronger than support or resistance level is.
price Gaps
Gaps occur in the Forex market when there is space between trading periods. Normally, the close of one chart period coincides with the opening of the next.
Gaps are often seen in the market open after the weekend but can also be seen when there is a significant rise or fall in price in a very short time.
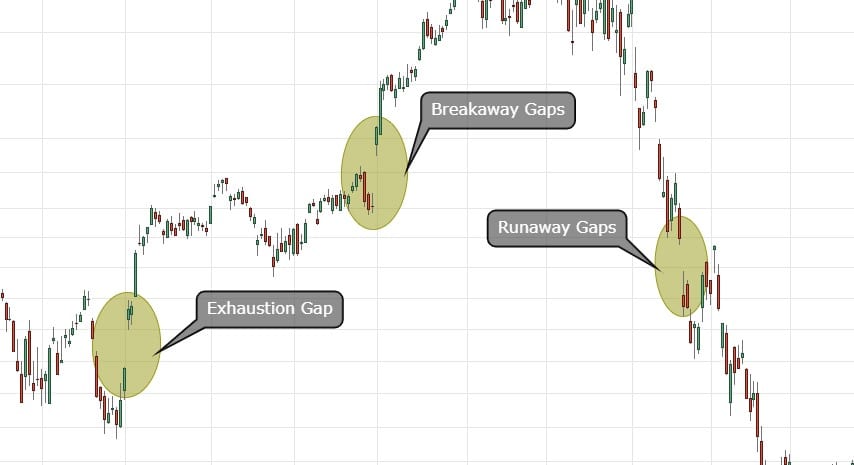
Gaps can be classified into three types: breakaway gaps, runaway gaps, and exhaustion gaps.
Breakaway Gaps
Breakaway gaps occur at the start of a new trend. This usually happens when the instrument is in a sideways consolidation phase, and some news event takes place.
Breakaway gaps can be considered a trend continuation gap due to the strength of the newly-formed trend.
Runaway Gaps
Runaway gaps are a trend continuation signal.
Trading runaway gaps for the continuation of the current trend is one of the safest of all trades, and this safety can be enhanced by confirming with other signals.
Exhaustion Gaps
Exhaustion gaps occur at the end of a trend and signal that the trend is about to end or even reverse.
This pattern can be used as evidence that a trend is ending.
Positions trading with that trend should be evaluated in light of other signals that may suggest that the trend is reversing.
Candlesticks and Price Action
The relationships between the parts of candlesticks create regular patterns. Long shadows can indicate the rejection of a price move.
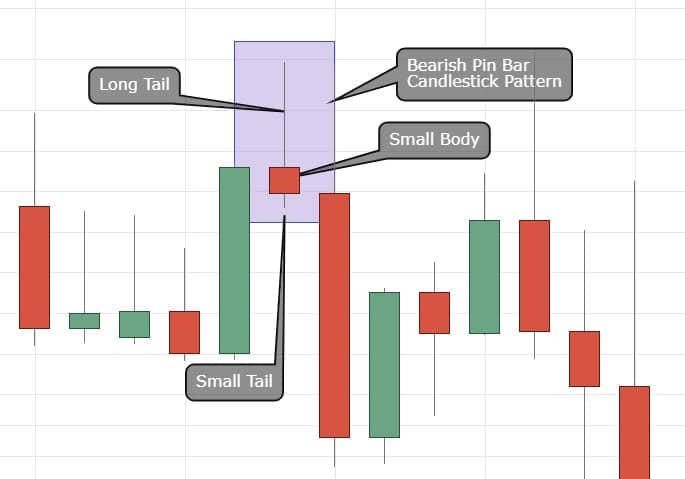
Pin Bars
A pin bar is a candlestick whose shadow is long on one side and whose body is small and closes on the opposite side of the candlestick.
When a long shadow extends up from a small body, this is a bearish pin bar.
The long shadow at the top of the candlestick suggests that the price attempted to move up and was rejected by the market, as indicated by the close at the body of the candlestick near the bottom of the candlestick.
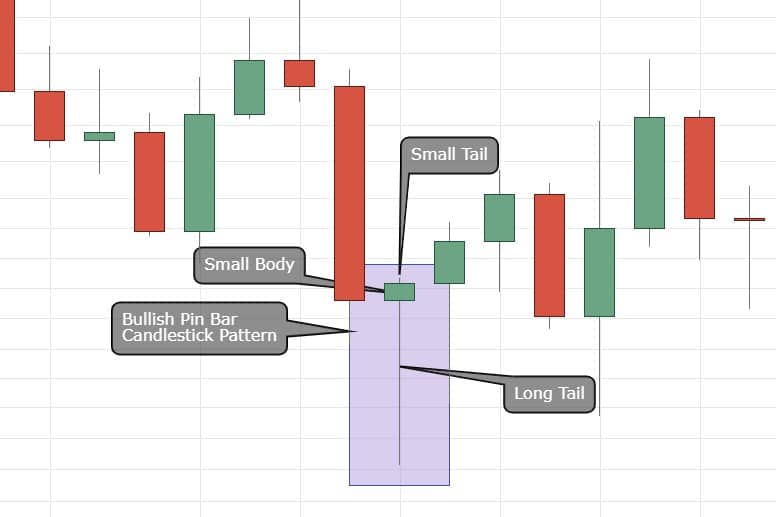
Hammer Candlesticks
When a long shadow extends down from a small body at the top of a candlestick, this is a bullish pin bar, also known as a hammer candlestick.
The logic here is the same as with the bearish bin par, only reversed.
Price was rejected at the long shadow end of the candlestick, suggesting that the market will continue moving away from it.
How to study technical Analysis Price Patterns professionally
Forums are one of the most popular places for sharing knowledge between people.
Sign in and follow opinion leaders Take advantage of their experience and learn their ways of trading.
You can also find quite a few online courses but check carefully before you sign up, and look for recommendations.
Of course, you can also learn independently with YouTube and the technical Analysis educational site.
But remember, there is no substitute for experience, so be patient and use the Demo account to improve and practice in the technical analysis.
Conclusion for Technical Analysis Price Patterns
Price patterns are quite logical when you learn them and understand what they can tell you about what is happening in the market.
It is not recommended to rely only on price patterns.
The right way to use price patterns, combined with price action, like support/resistance or supply/demand.


