
The Head and Shoulders pattern is one of the most reliable signals in forex trading to predict trend reversals. You might be wondering, How do you identify the Head and Shoulders pattern? To spot it, look for a sequence of three peaks: the first peak, known as the left shoulder; the second, and tallest peak, called the head; and the third peak, or right shoulder, which should be lower than the head but similar in height to the left shoulder. As the right shoulder starts forming and the price struggles to push higher, it signals that the uptrend is weakening, suggesting that the market may soon reverse.
Recognizing this pattern early, even before it fully completes, gives you an edge in predicting market shifts and preparing for potential trades. If you want to watch the part 1 video – the logic behind the inverse head & shoulders pattern, click here.
Understanding the Head and Shoulders Pattern
So, let’s start by making sure we’re on the same page about what a Head and Shoulders pattern looks like—and why it’s so valuable for traders. Picture this: you’re watching a chart that’s been trending upward steadily. Suddenly, the price reaches a peak (this is the ‘left shoulder’) and dips a bit. Then, it rises again, forming a second, taller peak (the ‘head’). After another dip, the price climbs once more, but this time, it only reaches a high near the first peak. This final rise creates the ‘right shoulder.
Now, why does this matter?
This pattern is actually telling us a story about the market’s mood. In a typical uptrend, buyers keep pushing prices to new highs, showing strong momentum. But with a Head and Shoulders pattern, that drive starts to weaken. When we see the price fail to reach a higher high on the right shoulder, it signals that the upward trend is losing steam and sellers might be ready to take over.
Example of Head and Shoulder Patterns
Example: Identifying the Head and Shoulders Pattern on the 4H Chart for USDCAD
Let’s say you’re analyzing the 4-hour (4H) chart for the USDCAD currency pair. The market has been trending upward, and you start noticing some subtle signs that a Head and Shoulders pattern might be forming.

Here’s how to break it down:
- Left Shoulder: The price begins at a certain low and rises to a peak—this is your first peak, or the left shoulder. On the 4H chart, the price reaches a high of 1.3500 and then dips slightly.
- Head: After the dip, the price begins to rally again, this time pushing higher than the previous peak. It reaches 1.3600, forming the head. This is the most important peak of the pattern, and the market has made a strong push upward.
- Right Shoulder: After the head forms, the price starts to fall again, only to rise one more time but fails to reach the level of the head. The price reaches 1.3550—forming the right shoulder, which is lower than the head but roughly at the same height as the left shoulder.
Basic Structure in Place
Now, at this point, the pattern isn’t confirmed yet, but you’ve got the basic structure in place. As you continue watching the chart:
- You’ll notice that the price isn’t pushing higher after forming the right shoulder, indicating that the buying momentum is fading. The market is showing signs of weakness.
- Volume also starts to taper off. During the formation of the head, there might have been a strong buying volume, but as the right shoulder develops, the volume starts to decrease, which supports the idea that the trend is losing strength.
- Break of the Neckline: The next critical step is to watch for the neckline. This is the level that connects the low points of the left shoulder and the right shoulder. Let’s say the neckline is around 1.3400. When the price breaks below this level, it confirms the Head and Shoulders pattern, signaling a potential reversal from the uptrend to a downtrend.
Why This Matters
By spotting the Head and Shoulders pattern early on the 4H chart, you’ve been able to identify that the uptrend for USDCAD is losing steam. Once the neckline is broken, you could consider entering a short position with a stop loss just above the head (around 1.3600), waiting for the downward move to continue.
Example: SPX500 Head and Shoulders Pattern
Let’s say you’re analyzing the SPX500, which represents the S&P 500 index, and you notice a potential Head and Shoulders pattern forming.
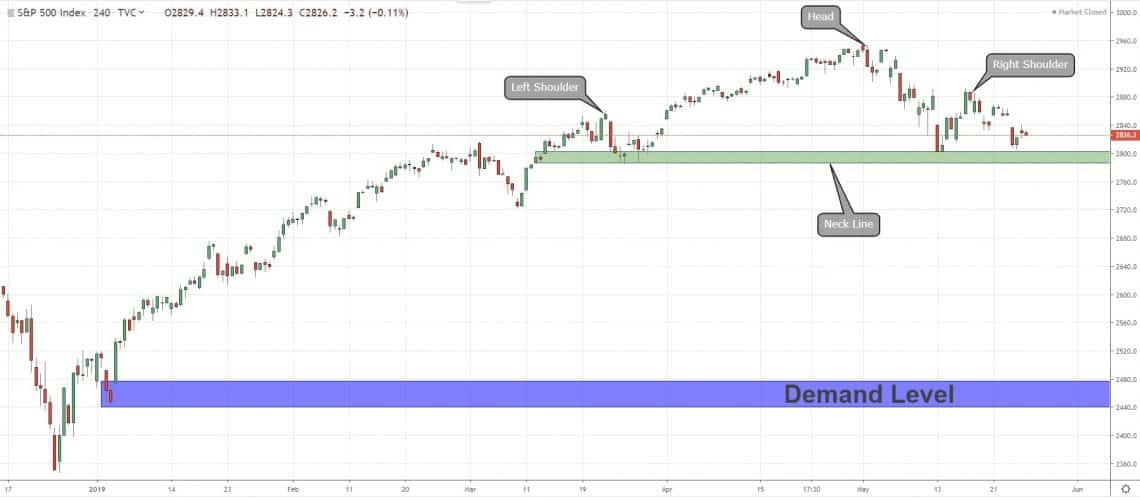
Here’s how you can spot and understand it:
- The Left Shoulder: The price of SPX500 begins an uptrend, reaching a peak at 4,400 (the left shoulder). After hitting this peak, the price starts to pull back, signaling a brief period of consolidation.
- The Head:
Next, the price rebounds and rises again, breaking past the left shoulder to form a higher peak at 4,500 (the head). This is the most prominent peak in the pattern, and it signifies the strongest bullish momentum before a potential shift. - The Right Shoulder:
After the head forms, you’ll notice the price tries to push upward again, but this time, it struggles to surpass the 4,500 level. Instead, the price climbs to a new peak near 4,400 (the right shoulder), roughly the same height as the left shoulder. This indicates a weakening of the uptrend. - The Neckline:
Draw a line connecting the troughs (the dips) between the left shoulder, head, and right shoulder. This is called the neckline, which serves as a key support level. If the price breaks below this neckline, it confirms the Head and Shoulders pattern and suggests that a trend reversal (from uptrend to downtrend) is likely.
In action:
As the right shoulder completes, the price struggles to move higher and eventually breaks the neckline at 4,400. This confirms that the pattern is complete, signaling a shift from bullish to bearish sentiment in the market. Traders who identified the pattern early can now consider shorting SPX500, taking advantage of the expected price decline.
Why This Matters
Spotting the Head and Shoulders pattern early gives you a clear advantage because it helps you anticipate a market reversal before it fully plays out. In the case of SPX500, once the price breaks the neckline, traders could look to sell (or short) the index, targeting lower levels. Without this early recognition, traders might miss the potential for profits as the market shifts from an uptrend to a downtrend. This is why understanding how to identify the Head and Shoulders pattern on charts, especially in major indices like SPX500, is a valuable skill for traders looking to predict potential reversals.
Example: GOLD Head & Shoulders Pattern
Let’s dive into a real-world example using the GOLD (XAU/USD) chart to understand how the Head and Shoulders pattern plays out in the market.

Imagine that GOLD has been in a strong uptrend for a while, steadily rising from $1,800 to $1,900. Now, here’s how the Head and Shoulders pattern unfolds:
- Left Shoulder: The price hits a peak at $1,900, and then pulls back to $1,880. This is the first high, and it forms the left shoulder of the pattern. At this point, traders are still confident that the trend will continue upward.
- Head: After the pullback, GOLD rises again and breaks the previous high, reaching $1,920. This forms the head of the pattern, which is typically the tallest peak. This move might have some traders excited, thinking the uptrend will continue, but the key is watching how the market reacts in the next phase.
- Right Shoulder: Following the peak of $1,920, GOLD pulls back again to around $1,890. After this, it rises once more but fails to break the previous high of $1,920, only reaching $1,910. This forms the right shoulder. The right shoulder usually struggles to reach the same height as the head, signaling that the uptrend is weakening.
- Neckline: To confirm the Head and Shoulders pattern, traders watch for the neckline, which is the support level formed by the lows of the left shoulder and the head (in this case, around $1,880). If the price breaks below this neckline, it confirms that the uptrend has reversed, and a potential downtrend may follow.
In this case, once GOLD breaks below $1,880, the Head and Shoulders pattern is confirmed, and traders can expect a potential trend reversal from bullish to bearish. The pattern suggests that the price might fall towards the next support level, say around $1,850 or lower, providing a clear entry point for a short position.
Key Takeaways from the Example:
- Key Levels: The left shoulder, head, and right shoulder form the pattern’s structure, while the neckline acts as the critical level to watch for confirmation.
- Weakening Momentum: The inability of the right shoulder to break the previous high shows weakening bullish momentum, signaling a potential reversal.
- Risk Management: After the price breaks the neckline, it’s essential to manage risk. A stop-loss can be placed just above the head ($1,920) to limit potential losses if the market doesn’t follow through with the reversal.
This is a typical scenario where the Head and Shoulders pattern in GOLD can help predict a potential reversal in the market. Recognizing the pattern early, before the price breaks the neckline, gives traders a chance to prepare for the shift and enter the market at a favorable point.
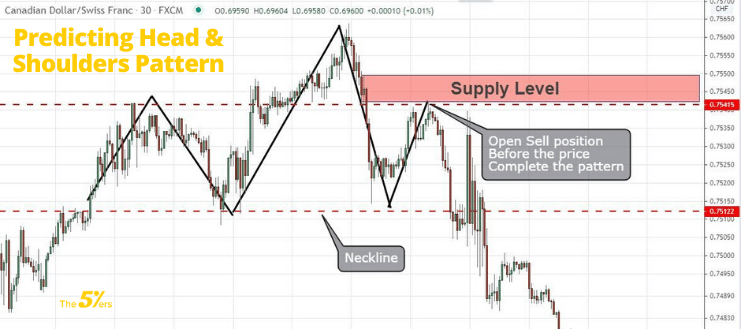
Early Clues: Spotting a Head and Shoulders Before It’s Complete
Now, here’s the fun part: Learning to spot the Head and Shoulders pattern before it’s fully formed. If you can identify the early signs of a potential reversal, you’ll be ahead of the game. The key is catching those subtle clues early on, so you can decide whether to jump in or simply watch how the pattern develops.
Here are a few early clues that a Head and Shoulders pattern might be forming:
- The Left Shoulder and Head Begin to Form: The first hint often appears when you see a peak, a dip, and then a higher peak (the head) shortly after. If you spot that higher peak and notice the price struggling to push higher, you might be seeing the early stages of a Head and Shoulders pattern.
- Slowing Momentum on the Right Shoulder: Once the head is in place, pay close attention to the next price move. In a typical uptrend, we’d expect the price to continue climbing. But if the price stalls around the same level as the left shoulder, that’s a sign the buyers are losing momentum.
- Volume Behavior: Volume can provide valuable insight. As the head forms, you’ll typically see strong buying volume. But once the right shoulder starts to form, volume often drops off. This decline in buying enthusiasm is an early signal that the market may be shifting direction.
Example of an Early Catch
Let’s say you’re watching GBP/USD, and you see the price makes a high around 1.4000 (left shoulder). Then, it dips and shoots up to 1.4100 (head), but on the next attempt to go higher, it struggles around 1.4000 again. If volume drops off as the price forms this “right shoulder,” you may be looking at the start of a Head and Shoulders pattern.
Key Technical Indicators to Support Your Prediction
While the shape of the pattern itself is crucial, technical indicators can provide that extra layer of confidence in your prediction. Here are a few indicators that traders often rely on when trying to spot a Head and Shoulders pattern early:
- Moving Averages (MAs): Moving averages can give you a sense of trend direction. When the Head and Shoulders pattern is forming, you might notice the price hovering below a shorter-period moving average (like the 20-day MA), especially near the right shoulder. This behavior suggests a weakening uptrend, hinting that a reversal could be around the corner.
- Relative Strength Index (RSI): RSI measures momentum and can indicate when a trend is losing steam. If you see the RSI making lower highs as the head and right shoulder form, it’s a clue that bullish momentum is fading. In the case of a Head and Shoulders, an RSI divergence (where the price makes higher highs, but RSI doesn’t) is often a strong sign that the trend might reverse.
- Trendlines and Support Levels: Drawing a trendline from the left shoulder through the head can sometimes reveal when the pattern is close to completion. When the right shoulder forms and price breaks below this trendline, it often signals that the pattern is confirmed.
Example Using Indicators
Imagine you’re analyzing USD/JPY, and you see a peak at 110.00, a dip, and then a higher peak at 111.00. As the price rises for the third time (forming the right shoulder), it struggles around 110.00, and the RSI fails to reach a new high. You might also notice the price hovering around the 20-day MA, showing weakness in the uptrend. This alignment between price action and indicators can give you more confidence that the Head and Shoulders pattern is forming.
Trading Psychology and Risk Management in Early Prediction
Now that you know how to spot the Head and Shoulders pattern early and back it up with technical indicators, there’s one more crucial piece to the puzzle: your mindset and risk management. Trading isn’t just about having the right tools and indicators; it’s about staying calm, sticking to your plan, and managing your trades responsibly.
- Patience is Key: Predicting a Head and Shoulders pattern early requires patience. The market doesn’t always follow a predictable path, and not every time you see a left shoulder and head will the pattern complete. Sometimes it’s tempting to jump in as soon as you spot the first clues, but that can lead to unnecessary risk. It’s important to wait for confirmation—such as the price failing to make a higher high on the right shoulder—and then making sure the volume and indicators align. Patience will pay off in the long run.
- Managing Your Risk: One of the best ways to approach trading is with a solid risk management strategy. Even when you’re confident that the Head and Shoulders pattern is forming, you still need to be cautious. No setup is foolproof. Consider setting a stop-loss just above the right shoulder or slightly below the head to protect yourself in case the pattern fails. By limiting your losses on a bad trade, you can ensure that even when things don’t go as planned, they don’t wreck your account.
- Position Sizing and Leverage: It’s essential to control how much you’re risking on any given trade. For example, if you’re trading a high-risk setup like an early Head and Shoulders prediction, consider reducing your position size. Leverage can be a double-edged sword—while it offers greater reward, it also magnifies risk. Use leverage wisely and adjust your position size based on the confidence you have in the trade and your overall risk tolerance.
Example of Risk Management in Action
Let’s say you’ve spotted the early signs of a Head and Shoulders pattern forming on the AUD/USD chart. The left shoulder has formed at 0.6700, the head at 0.6750, and the price is now struggling around the 0.6700 level. You’re feeling confident this could be the real deal, but you decide to wait for the right shoulder to form before entering the trade.
As the price begins to form the right shoulder, you place a stop-loss just above 0.6750 (the head). You calculate your position size so that your risk is limited to a small percentage of your overall trading capital—say 1-2%. This allows you to manage risk while taking advantage of a potential market reversal.
Practical Application: Real-World Examples and Charts
The best way to really understand how to predict the Head and Shoulders pattern early is by seeing it in action. Let’s take a look at a real-world scenario where this strategy could work in your favor.
Imagine you’re trading the USD/CAD currency pair, and the price has been steadily moving upward. You’re looking at the chart and see the following:
- Left Shoulder: The price reaches 1.3500, then dips to 1.3400.
- Head: The price then pushes higher to 1.3600.
- Right Shoulder: The price attempts another rise but only gets as high as 1.3550.
At this point, the pattern isn’t complete yet, but you’re seeing signs of weakness in the uptrend—especially with the price failing to break above the previous high. You also notice that the RSI is not confirming the price’s new high, and volume is beginning to taper off.
What do you do next?
- You wait for the price to break below the neckline (1.3400), confirming the reversal.
- At that point, you can enter a short position, placing a stop just above the head (around 1.3600).
- You’re also keeping an eye on the volume and RSI to ensure they align with your prediction of a reversal.
This practical example shows how the early signs, combined with your indicators and trading rules, can help you get ahead of the curve. While not every setup will work out perfectly, the more you practice identifying these patterns early, the better your chances of success.
Common Mistakes to Avoid When Predicting Head and Shoulders
Even with a clear strategy, predicting a Head and Shoulders pattern early can be tricky. Here are some common mistakes traders make and how to avoid them:
- Rushing the Trade: One of the most common mistakes is jumping in too early. Just because the left shoulder and head are forming doesn’t mean the pattern is a sure thing. Always wait for the confirmation of the right shoulder and other technical indicators before committing.
- Ignoring Volume and Indicators: Volume and indicators like RSI can give you a heads-up on whether the market is truly weakening. Don’t just focus on price action—use these tools to back up your assumptions. If volume is weak during the formation of the right shoulder, don’t ignore that!
- Forgetting About Risk Management: The excitement of catching a potential trend reversal can sometimes make traders overlook their risk management strategies. Never forget to place stop-losses, manage your position sizes, and avoid overleveraging, no matter how confident you are.
Closing Thoughts
Predicting the Head and Shoulders pattern before it completes is a powerful skill that can set you apart as a trader. By identifying early clues like the formation of the left shoulder and head, monitoring volume and momentum, and using key technical indicators, you can get ahead of the market and prepare for a potential trend reversal.
Remember, it’s not about rushing to get in but about being patient and using the tools at your disposal to make an informed decision. Trading psychology and risk management play a massive role in ensuring that even when your predictions don’t work out, you’re protected.
Whether you’re new to forex or have been trading for a while, understanding how to spot these patterns early is a valuable skill. Resources like The5ers are here to support you every step of the way, offering educational insights and a community of traders to help you grow.
Understanding this pattern is key, but learning to catch it before it’s fully formed? That’s the real skill, and it’s what we’ll focus on next.
Join Our YouTube Community for even more helpful content.


