
Bull flag vs Bear flag
In the world of technical analysis, there are many patterns that traders can use to identify profitable opportunities in the markets. The bull flag and bear flag are amongst the most popular. This guide shows the bear flag vs. the bull flag.
What is a Flag Pattern?
A flag pattern is a technical analysis pattern that is a continuation pattern in the current market movements.
A flag chart pattern is generated when the market returns to a small range after a large move. Most of the time, when a flag breaks out, it does so in a way that continues the previous pattern. So if you’re willing to put in a little risk and reap big rewards with flags, you’ll have a great return on your investment. Price bars ranging from five to fifteen make up a typical flag, which may be observed in any time frame.
There are multiple different flag formations within the bull flag and bear flag that are shaped by the consolidative period that is the “flag.” Throughout, we will identify the differences and how to trade them.
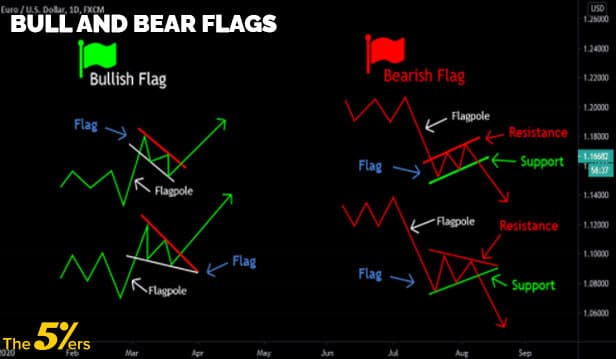
The difference between a bull flag vs. Bear flag?
The difference between the bull flag and bear flag is fairly simple. They are mirror images of themselves. The bull flag is a bullish chart pattern, where you would see a price rise (sharply, and regardless of the time frame), followed by consolidation and then the break to continue bullish.
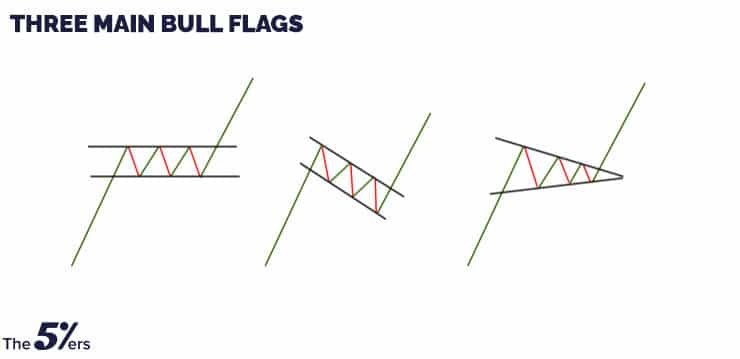
Take a look at the following example of the different bull flags you are expected to see in the market.
There are three MAIN bull flags to consider. Now in a real-life example, it’s not as easy. These are GENERAL shapes.
- Range flag
- Descending channel flag
- Wedge flag
These can be seen on different time frames, regardless of the timeframe that you go on.
The bull flag is used as a breakout pattern typically to confirm that the upside is the right side, so you would have to wait for the break of a key resistance, which is typically the flag pole top!
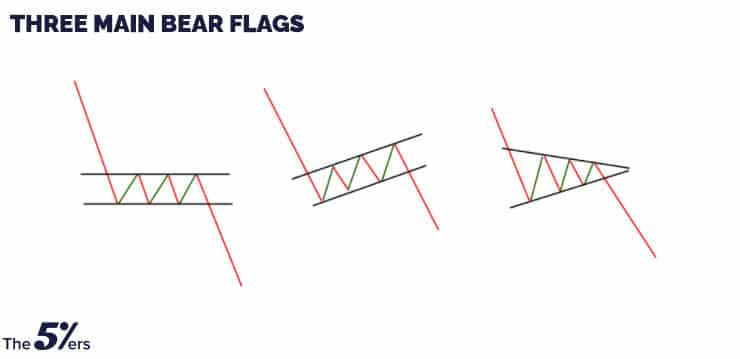
If you look at the bear flag, the possibilities are the same. However, they are to the downside.
1. Range flag
2. Ascending channel flag
3. Wedge flag
What does a bull and bear flag indicate?
The bull flag and bear flag both indicate similar things: the accumulation of market participants in different directions. This means, when there is a move in either direction of the market, if the move is weak, you expect a retrace into balance. A move that is sharp, up or down escapes balance.
In a bull flag scenario, you see the market shoot up. Then the flag itself is formed. If the move to the upside were weak, then the retrace would happen, and you would see a return to balance. Instead, you get accumulation in a range, which means that a new balance is created and the buyers are strong enough to hold out any selling. This is very bullish.
In a bear flag scenario, you would see a sharp drop in price followed by seller accumulation at the lows of the move. This is very bearish because the buyers cannot pull the price back to where it came from. Rather the sellers keep adding to a position. Then the downside opens up for another sell leg. This shows strong seller control.
How reliable is a flag pattern?
In the eyes of traders, flag patterns are one of the most popular continuation patterns since they provide a great opportunity to get into an already established trend. This is because flag formations are all pretty similar, and they often do so in settings comparable to the current trend.
The reliability of the pattern is like any other pattern. You cannot simply trade a pattern and expect it to work. You have to have an entry and exit strategy based on the pattern itself. It is hard to put a probability on the pattern; however, understanding why and how the pattern forms allow traders to navigate the patterns successfully.
Bullish Flag
Let’s dive in-depth and review the bull flag pattern
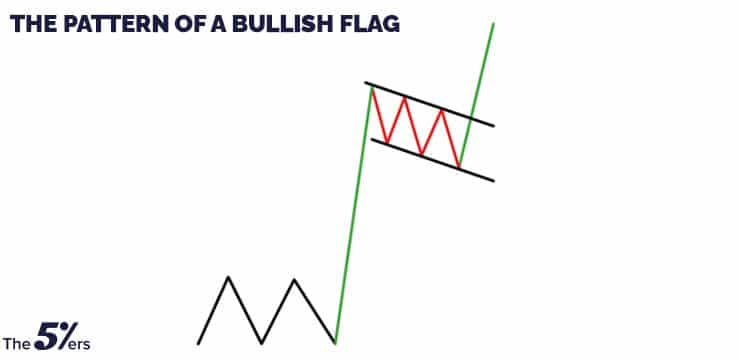
The bullish flag pattern structure
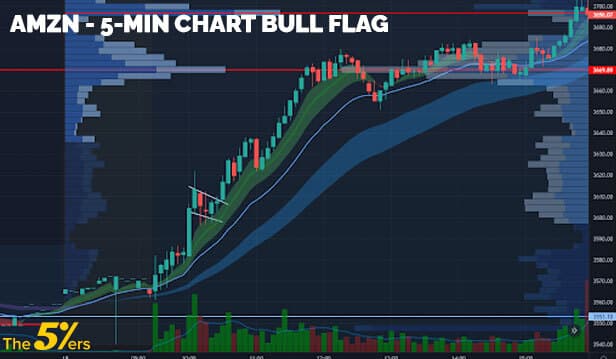
The pattern structure of the bull flag is very simple. You can observe the pattern in any time frame, whether it’s daily or intraday. You are looking for a series of green candles followed by a stall of some sort without retracing the move that brought the price up to these levels. This creates accumulation at the tops.
This is an example of intraday AMZN (Amazon) on a 5-min chart. You can see the original move to the upside, then a stall over a short period of time creating the flagpole. The break-up results in a strong $100 move in the stock. In this example, you can see the slumping downward bull flag.
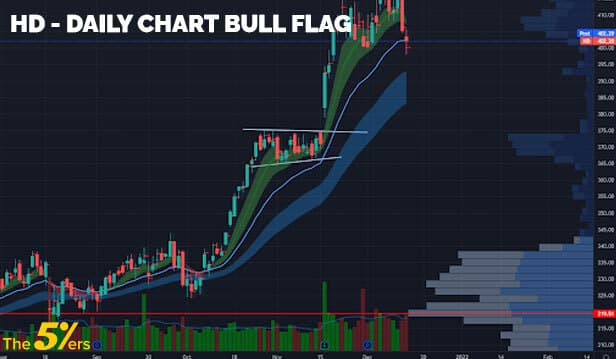
You can also witness this on a daily chart. This is an example of HD. This stock had a very nice run-up and started to stall out, forming buyer accumulation at the top of this channel. We have created the sideways range-type bull flag. With a break of 375, the price went to 415.
How to Trade Bullish Flag
It is difficult for novice traders and investors to detect a bull flag on a chart. But there are several things anyone can keep an eye out for to profit from this trend. First, this pattern is all on volume, so keep an eye out for that. Indicators of a breakout’s success might be confirmed by the amount of activity in the market.
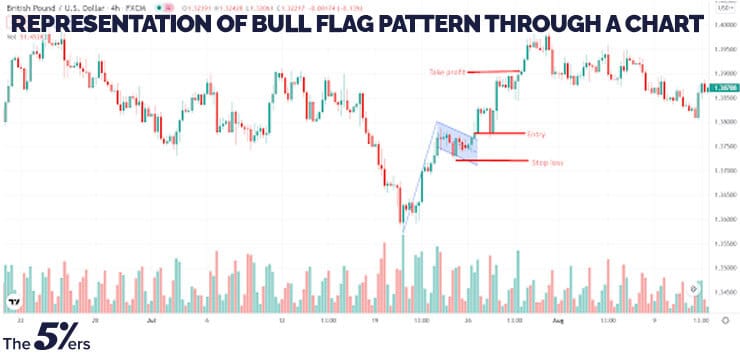
Another thing to look for is a clearly defined descending trend line that serves as the breakout point. For example, in the bullish flag pattern, you can see that the trend line is well defined. Thus, when it eventually broke through, the price surged. You can also observe how well the line links to the rejected moves up.
It is critical to note where to pull out of the trade when trading a bull flag pattern if the setup fails. The point on the chart where you realize that this setup is no longer working out and it’s time to go.
This transaction can be handled in several different ways. Putting your stop-loss below the consolidation area is the most common. A line is drawn out at the bottom of the flag pattern in the image above. As soon as this setup no longer works, it’s time to accept a defeat and move on to the next opportunity. Alternatively, you might utilize the 20-day moving average as a stop-loss. Consequently, if the price closes below that moving average, you would exit your position.
As soon as a fresh trade swings into profit, raise your stop to breakeven. You’ll feel more secure now that you have risk-free trade. Then sit and relax once the price hits 75% of the gap between the risk and reward goals. You will now have the option of liquidating position all at once or in segments.
If you want to capture the meat, then you should use trail stop-loss.
View this post on Instagram
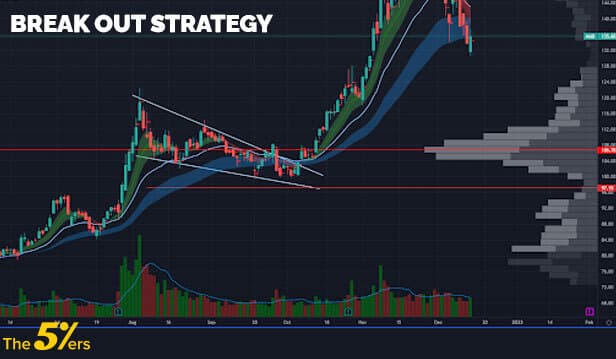
Break out strategy
The most common strategy for the bull flag is the break-out strategy. Rather than trying to anticipate the low of the flagpole, look for the break of the tops. If you are looking for the lows of the flagpole, you may get caught in an overall reversal, and the price can retrace the whole move lower.
This can be used for day trading or swing trading.
The entry can be found in 1 of 2 places.
- The flagpole top (break)
- If a descending bull flag, the lower high breakout.
Here is an example of AMD (Advanced Micro Devices) of the potential break of BOTH areas. This provides us with two entries. Now keep in mind the top of the flagpole area is the higher probability entry. (you can choose a wick for a more effective breakout).
- The green line represents the most recent lower high. Based on market structure principles, if this area breaks, the trend breaks, meaning a reversal.
- The yellow line represents the flagpole breakout at the top of the structure, which can be the higher probability trade.
If you are trading on a daily chart mainly and want to get a confirmation move, you would want a 1-hour candle close above the area to confirm with heavier volume.
This can be applied to day trading as well, using a 5-min candle close above the area.
The target on these trades is the following:
- If you enter at the lower area, the prior lower-high resistance break, you will look for the first target at the top of the flagpole, then the second the length of the flagpole above the top of the pole.
- If you enter at the breakout of the flagpole top, you will look for the length of the flagpole as a target. If the flagpole length is $20 from the base, you can look for 50% to 100% of that move on the break.
Bearish Flag
Let’s dive in-depth and review the bearish flag pattern
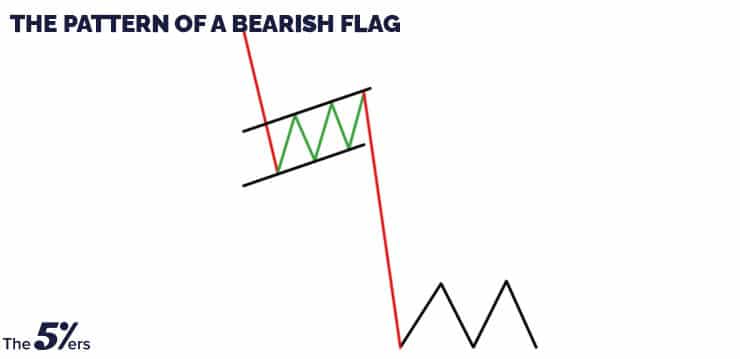
The bearish flag pattern structure
A bear flag is a quick volume reduction on a negative development that happens when the price of underlying asset rebounds by moving laterally to higher price action on the weaker volume before abruptly plunging to new lows on strong volume.
A falling trend is used to create a bear flag pattern, followed by a consolidation or trend line pause. The flagpole refers to a powerful downward movement, whereas the flag refers to a consolidation. There are two parts to a chart pattern known as a “bearish flag.” Flagpoles always point downwards, and flags are always oriented in the same direction.
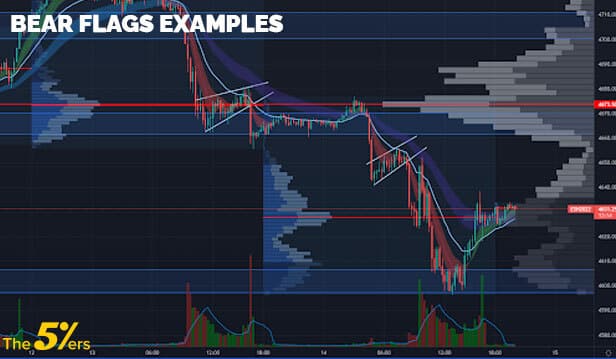
The premise is you’re looking for a large red candle or a series of red candles followed by an accumulation that can even be slightly skewed to the upside. Take a look at the S&P 500 futures chart on the 15-minute below.
You can see two bear flags in the midst, which result in a breakdown and the continued sell after coming from a large sell area.
How to Trade Bearish Flag pattern
You may easily identify the bear flag’s sell indications.
A breakout below the flag is the perfect time to get in on the action. The flag breakout indicates that the downturn is about to continue.
Remember that the little consolidation dubbed the flag is a halt or corrective in the negative trend.
Trading chart patterns appear in a wide variety of sizes, which is an unavoidable fact. Consequently, there will never be a pair of bear flag designs that are exactly the same.
Once we have established a bear flag and bull flag chart patterns, we can see how the market moves when we see the flag pole pointed higher.
We can break out of 2 different areas, depending on the flag itself.
Here are the potential entries:
- Breakout of the flagpole bottom
- Breakout of the higher low to the downside
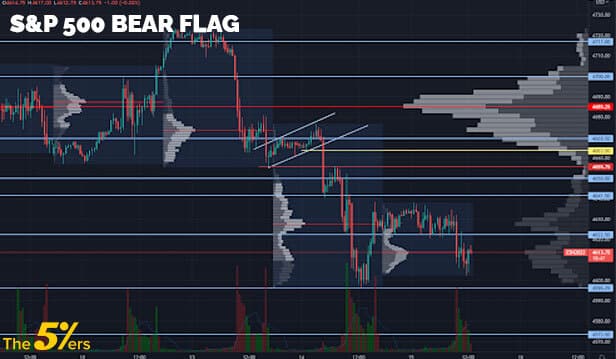
Using the S&P 500 futures example, we can see the following two entries:
- Yellow line, this is the more aggressive entry, where we would wait for the break under the prior higher low. In this case, it is 4663.50. Under this area, we look for the aggressive short size down into the flagpole bottom (4655.50). Then through that area. This more from beak to flagpole bottom is 8 points or $400 on 1 contract of the S&P 500 E-mini futures contract.
- The red line here is the more conservative entry where we wait for the flagpole to break and look for the move lower. This is the break of 4655.50, and we move ideally the length of the flagpole, which is about 20 points or $1,000 a contract. Notice you get a retest on the move and then back down. This is another way you can play the bear flags.
Just like with the bull flag, risk management is very important. You want to make sure your stops are accounted for, and your stop placement is correct. Usually, we want to place a stop above a high on a short so that we can protect against a change in structure. Meaning in the example above with our yellow line (original entry), it is a lot easier for us to place the stop above 4675 because that is the prior top and risk about 8 points. If you are getting in on the flagpole break, then you may have to withstand a wider stop. If you trade stock or options, then you can have a more reasonable stop. Let’s look at an example.
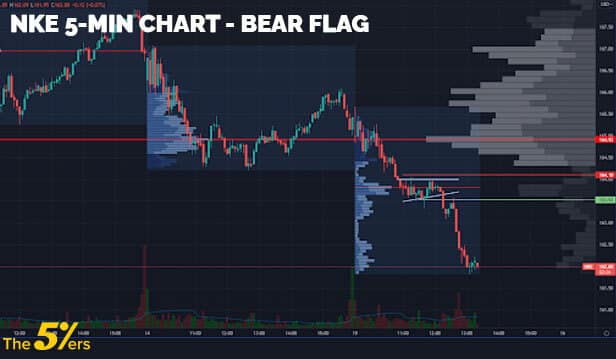
Below is NKE (Nike) on a 5-min intraday chart where we can see a bear flag-shaped up midday. From there, we have two levels, red and green.
- The green area is your entry, which is the break of either the flagpole top or the higher low from the bear flag. In this case, 163.55.
- The red line is where your stop is going to be, 164.10, which is under $1.00 from the entry. Depending on the size of the trade, the risk may be high or low. Compared to the futures, it’s not that drastic of a difference.
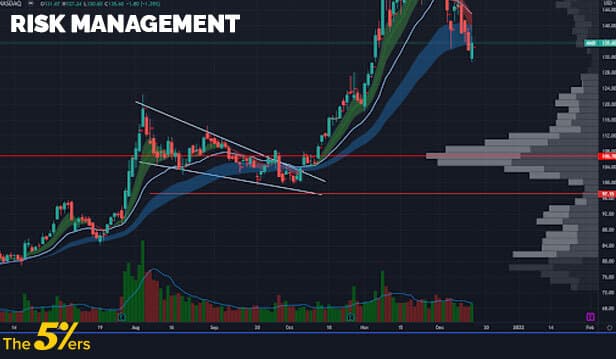
Risk management
Risk management is very important in any trading strategy, so you will have to understand where your risk is, and you can use that for position sizing. If you base your stop on the chart and where the support needs to hold, you want to put your stop below the base of the bull flag. In this case, it would be where you see the rotations holding out in AMD at 100. Meaning you can put your stop under the level. You want to give it breathing room. If you put your stop at 99.50, it can easily tick your stop and then go. You want to put it 2-3% under the key support.
Advantages and Disadvantages of Trading the Bull and Bear Flag Pattern
Let’s summarize the pros and cons of trading the flag pattern
Here are some core benefits of using flag patterns
- Flags are continuation patterns. They aid traders in determining what stage of the trend they are currently in.
- Trades should only be made when the price breaks through an important resistance/support level or when the market has a significant dip in the other direction. This means that when an up-trending flag is broken, a transaction can be taken advantage of. We are given a set of predetermined levels to play at using the breakout.
- If all of the ingredients are in place, the pattern is regarded as challenging to trade. A classic bullish flag pattern is formed when the retracement reaches 38.2 percent. As a result, the risk-to-reward ratio is quite favorable.
- The breakout trade has a high potential to be a strong momentum move in your direction.
- They are easy to spot.
- They can be traded on any time frame and any trading style
- The risk is very easily identified
- You are aware of when the pattern fails, so you can get out of the trade without losing too much.
The major disadvantage of flag patterns is
- A reversal pattern can be formed if the corrective wave is protracted and below 50%.
- The pattern can take time to develop, and It can even take weeks to months to be confirmed.
- The pattern doesn’t guarantee future movement. No patterns do
- The pattern can make a false breakout.
Bull Flag vs Bear Flag Summary
In summation, the bull and bear flag patterns are great tools for traders when day trading or swing trading. You can identify the pattern in any market condition or time frame.
Price patterns might reveal what traders think and feel about the market at certain price points. These indicators provide you an advantage over traders who depend on only fundamentals. Remember, flag patterns perform best when used in conjunction with additional trading signals and indicators.
About Author:
Hi, I am George Papazov, CEO, Founder & Head Trader at Tradepro Academy™. Tradepro Academy is a well-known community in the professional trading industry. Our business is designed to teach action takers how to succeed in trading. We teach you how to fish and how to build a sustainable long-term career in trading.


