
Cup-and-Handle Pattern
Chart patterns capture traders’ emotions of greed and fear as they react to news events and other market developments. These patterns often have predictive value, as people tend to react in the same way to the same stimuli. However, chart patterns aren’t always fail-safe.
In this article, we’ll illustrate how what looked like a promising cup-with-handle pattern in the EUR/CAD currency pair ultimately broke down.
We’ll also explain how you can protect yourself. But first, let’s discuss what you should look for in a cup-with-handle pattern.
Cup-and-handle pattern characteristics
A cup-with-handle pattern is a continuation pattern that occurs after a 30% or greater increase in price. You could think of a continuation pattern as a temporary pause in an uptrend. It’s a moment in which some investors take profit and others reassess their bullish investment case.
As prices fall from their local high, they should form a U-shaped pattern, which resembles a cup drawn from the side. It’s important that the pattern resembles a U rather than a V to give time for speculative hands to sell and new investors to come in.
In his 1988 classic book titled “How to Make Money in Stocks”, William O’Neil suggests the cup depth should settle between 12% and 33% from its high, although some stocks could experience declines between 40% and 50% when markets are volatile. Whilst his advice was written for stock pickers, it holds true across other asset classes.
Once the cup completes, the price may experience a minor 10% to 15% pullback from its recent high over one to two weeks. This downward price channel resembles a handle. According to William O’Neil, the strongest handles drift sideways or downwards, rather than up, but must remain over what he called their 10-week moving average. William O’Neil ran his analysis across weekly averages, with the 10-week moving average equivalent to today’s 50-day moving average.
Cup-and-handle head fake
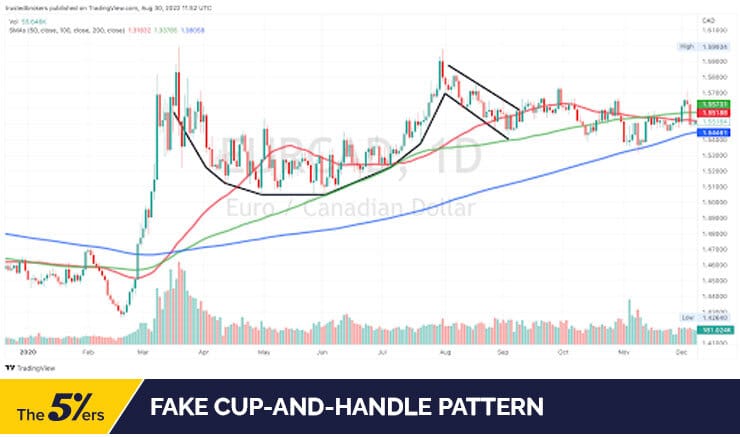
The EUR/CAD currency pair appeared to form a cup-with-handle pattern starting in March 2020, after rising 12% from a low of 1.4264 to a high of 1.5991 over a 4-week period. The pair’s exchange rate then dropped 6% as it formed a U-shaped base followed by a downward-sloping handle.
However, what looked like a promising chart pattern ultimately failed to deliver, with the EUR/CAD currency pair failing to break out to the upside. Instead, it traded sideways in the following months before breaking down in 2021.
Five early warning signs
Upon closer inspection, we found 5 signs that should’ve called the validity of this pattern into question. Together, these signs all pointed to a loss of momentum in what was a weak prior advance.
- Prior advance: whilst the pattern occurred after a rise in price, the 12% price appreciation didn’t quite meet the recommended 30% threshold.
- Pattern length: cup-with-handle patterns can unfold over 1 to 6 months but are usually complete over 1 to 4 weeks. This pattern occurred over a 6-month period. The longer the pattern, the more likely it is that price momentum fades.
- Base depth: whilst the EUR/CAD formed a U that bounced off the 100-day moving average (plotted in green in the chart), it only fell 6% from its local high, rather than the expected 12% to 33% pullback. This is perhaps a reflection of the weaker prior advance in price.
- Handle: whilst the handle sloped downwards in a tight price channel, it failed to consistently remain above the 50-day moving average (plotted in red in the chart). A breakdown below the 50-day moving average is a testament to a loss of momentum.
- Volumes: trended lower over time instead of rising in the second half of the cup, even as the EUR/CAD pair made new highs. Weak volumes show a lack of buyer interest and should’ve called the validity of the price advance into question.
If you’d like to review examples of successful chart patterns, this chart patterns PDF could be of interest. It analyses 20 classical chart patterns and links to interactive charts on TradingView.com to help you place these charts in their context.
How to protect yourself
Most traders prefer to wait for a chart pattern to prove itself before opening a position. In this case, this would’ve meant waiting for a convincing breakout above the 1.5991 high before going long. The breakout validates the pattern and confirms the resumption of the prior uptrend. Importantly, a breakout should also be underpinned by rising volumes.
Some traders take an even more cautious approach and wait until a successful re-test of the breakout before initiating a position. This means waiting for the breakout to lose momentum, falter and resume its uptrend before going long.
You could follow the first approach, the latter, or combine them over two trades. But, no matter what approach you follow, it’s generally advisable to let a chart pattern prove itself.
Author bio
TrustedBrokers.com is a comparison service for traders interested in Forex, stocks, crypto, and CFD brokers. Easily compare brokers down to the account level to find an account that matches your experience and investment preferences. We’ve reviewed broker spreads, leverage, and platforms to help you make an informed decision.
👉 If you want to receive an invitation to our live webinars, trading ideas, trading strategy, and high-quality forex articles, sign up for our Newsletter.
👉 Click here to check our funding programs.


