
The Head & Shoulders pattern is a very common pattern, and the Quasimodo pattern is a variant of it. It’s a very powerful pattern, so it’s worth knowing how to spot it, how to identify it, and of course, how to trade it.
Both patterns are trend reversal patterns – they form when there’s a slowing momentum in the trend and a potential beginning of a new trend.
What are Head & Shoulders
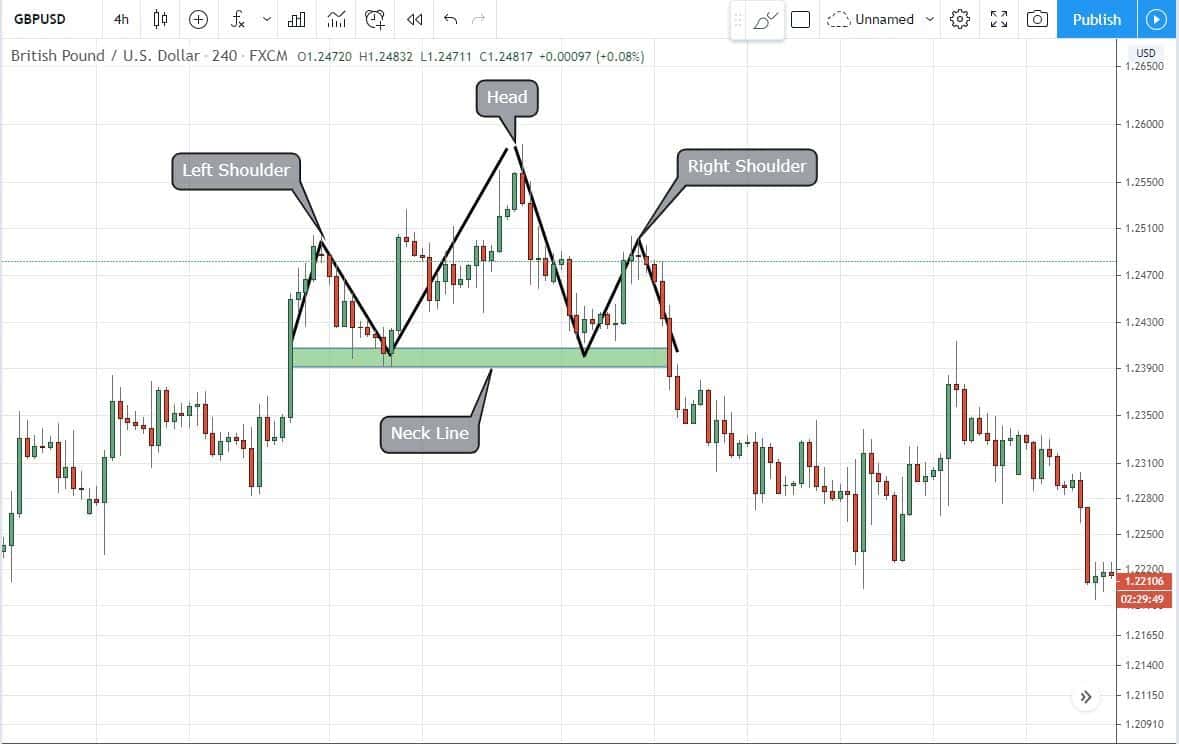
The head & shoulders pattern forms when we have an uptrend forming higher highs and higher lows. Then a low, not higher than the previous one but at the same price, on the same line, forming what is called the “neckline,” then a next high is formed lower than the previous one, then reverse in the trend.
In the head & shoulders pattern, we have the left shoulder, the head, and the right shoulder. This forms the neckline, and a break of the neckline will confirm the reverse in the trend and completion of this pattern.
What is Quasimodo Pattern?
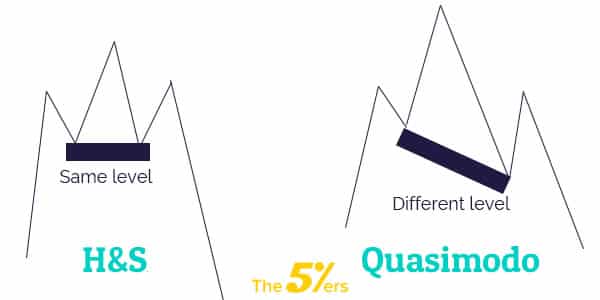
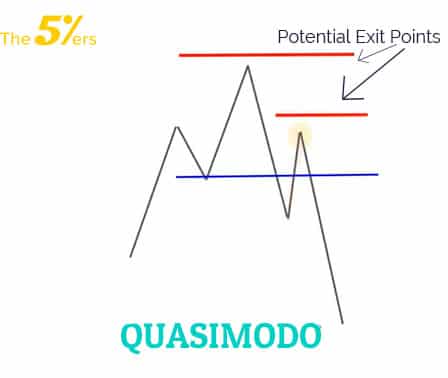
If you saw the movie “The Hunchback of Notre Dame” about Quasimodo, then you know he has a slightly different shape, namely, one shoulder is higher than the other shoulder.

We have the left shoulder, a low, a higher-high, and then the next low is lower than the previous one, so it’s not like a regular Head & Shoulders pattern which is at the same level, but this next low is lower and causes a break from the previous low.
Then we have a high, which is lower than the previous high, and then the continuation lower.
Watch this video explaining the differences between Quasimodo and Head and Shoulders patterns.
How to trade Quasimodo and Head & Shoulders
So let’s see how to trade those patterns:
Potential Entry Points and Exit Points for head and shoulders
The Head & Shoulders pattern has two potential entry points –
The first entry point is at the height of the right shoulder, after forming a high, a low, and higher high and then a low at the same level.
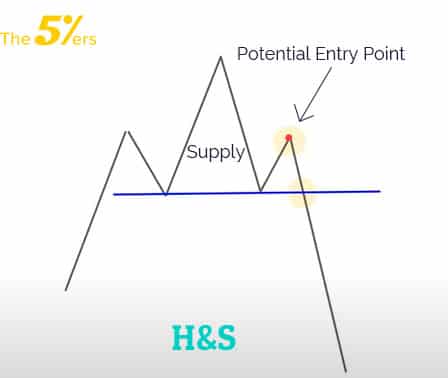
Once the market is going up to form the next movement, the next pivot, and if you have supply back at the “head,” you could enter, anticipating that this will form a Head & Shoulders pattern, then you can sell at the top of the right shoulder, anticipating that there will be a reaction after it that will eventually form the Head & Shoulders pattern.
There’s some risk with that because it could just continue up to the head level. So if you’re looking for more confirmation, then you can get in at the break of the neckline.
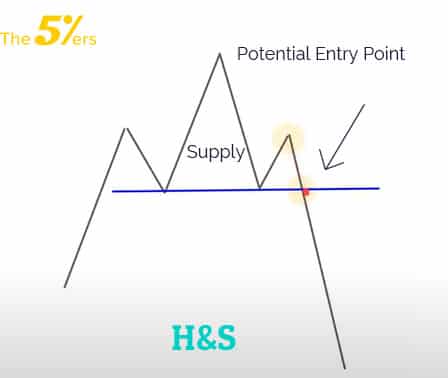
Once you have this pivot formed and prices start moving down, then you can see the pattern of the Head & Shoulders formed completely, and you can place a sell stop, or you can just sell the market at the neckline, anticipating the break of the neckline and completion of the pattern.

The Quasimodo has two variants and two entry points
The first one will be similar to the Head & Shoulders-
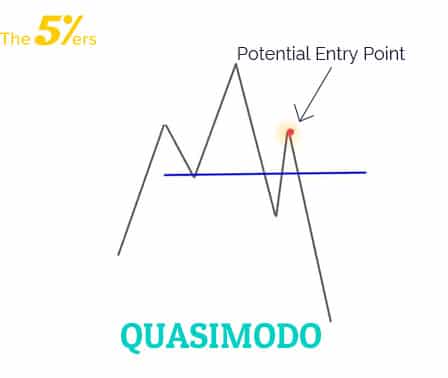
We have high – low – high – low, and then once the market goes up again, usually it’s close to where the left shoulder was formed or, again, if there’s a supply back in the “head” area, then you have your entry point at the top of the right shoulder, to go low.
Sometimes the pullback is not so deep, and it only goes to the neckline. So the touch of the neckline would also be an opportunity to sell the market.
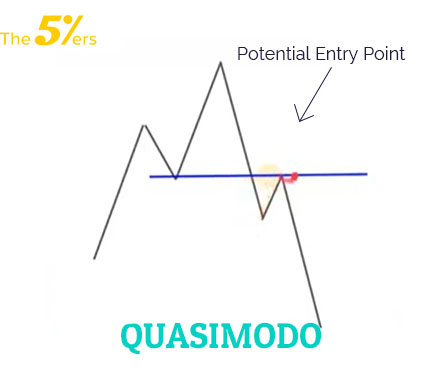
We can sell either similar to the Head & Shoulders at the right shoulder with a limit order, or we can sell at the first retracement, the first touch of the neckline.
You might have heard of resistance becoming support or support becoming resistance, so if this pivot was previous support, got broken and re-tested the previous support, now resistance we might see a reaction there, and that is also an outside range or a Quasimodo pattern.
Where to place Stops
The stops need to be at the top of the head, which is the previous high, or you can also place your stop above your right shoulder.
If you place the stop above the head at the pivot high, then you give yourself more room, but of course, your risk-reward will be smaller than if you place your stops above the right shoulder, or you can start placing it at the top of the head and then trail it, move it once you have confirmation.
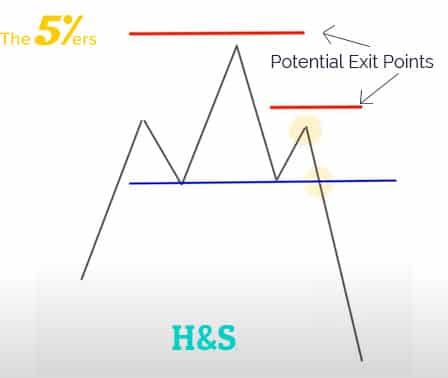
The same happens with Quasimodo. The exit point can be above the head or above the right shoulder those are the levels.
Examples of Quasimodo and Head & Shoulders
Quasimodo
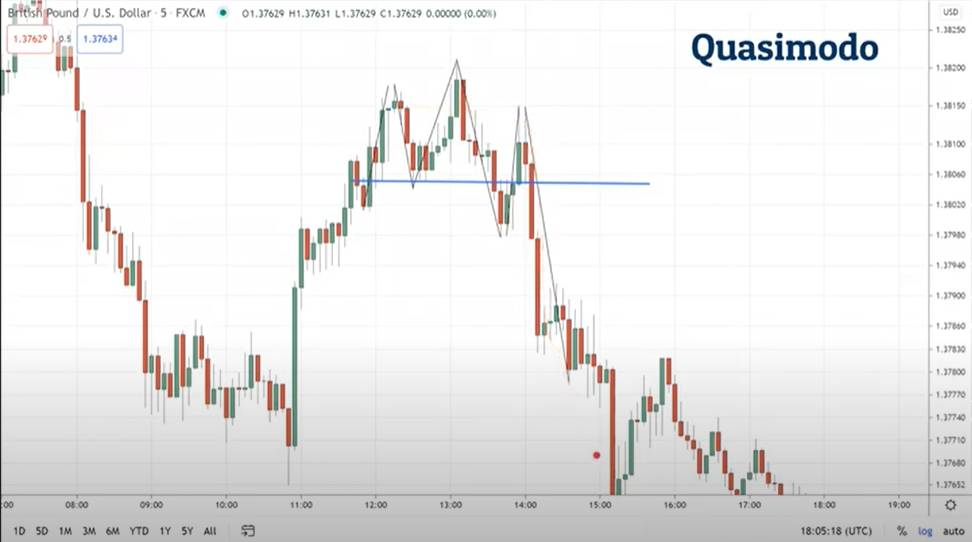
Let’s start with this Quasimodo that was formed on the GBP/USD 5 minutes chart-
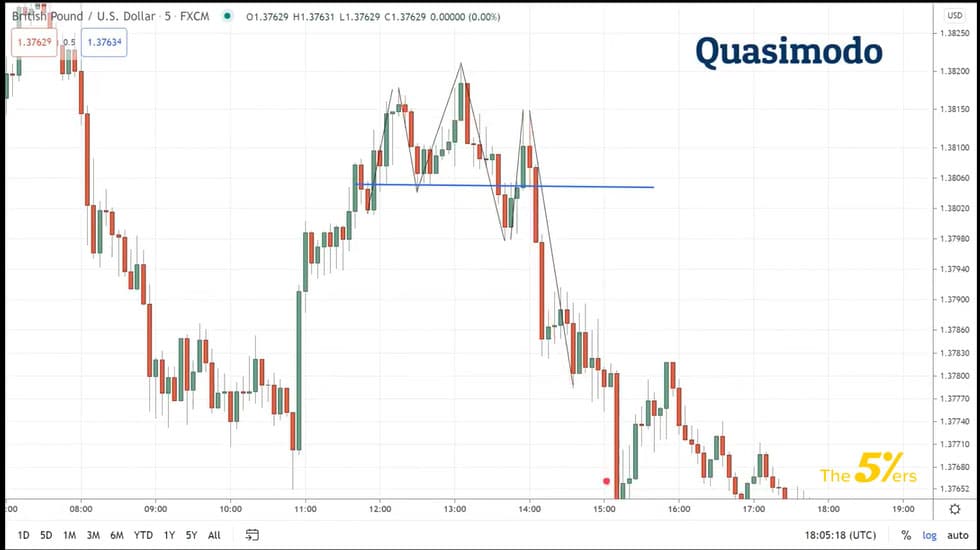
On this chart, you can see a low, high, kind of consolidation, high – low – high – low – higher high, break of the previous low, retracement to the supply area where it’s kind of at the same level as the left shoulder and the continuation lower.
We didn’t have the test of the neckline. You can see on the line that it had retracement all the way to the supply form and continuation lower.
Inverse Quasimodo
We have the same pattern just to the other side.
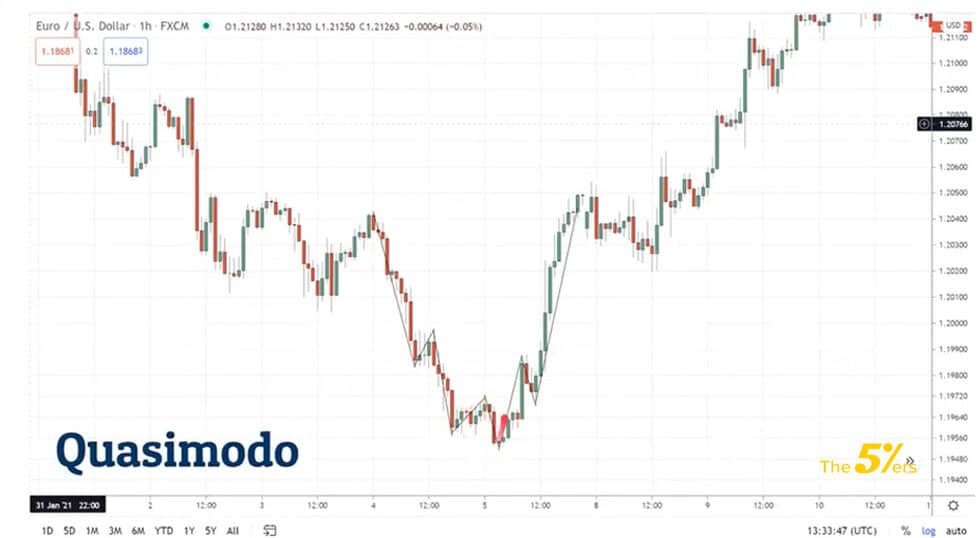
So we have the downtrend, we have a high – low – high – low – high, lower low, then we have the break of the neckline, and we have a higher high – retracement to the breaking point, that brings us back to the neckline because the demand form and continuation higher.
That was the inverse Quasimodo – The end of the downtrend in order to become an uptrend.
Head & Shoulders
British Pound / Japanese Yen on the 15 minutes chart
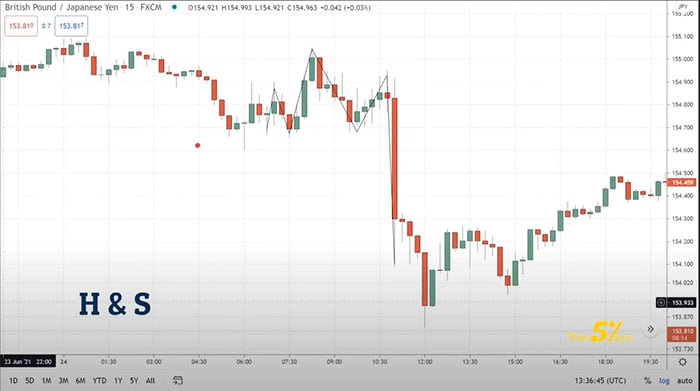
We have consolidation, and then the chart goes up – high – low – higher high – low at the same level which forms the neckline, then high, and we break lower.
We didn’t have a clear supply area, but once we identify we have this form completely, we just place a sell stop order there, and you can trigger into the next movement down.
Quasimodo and Head & Shoulders Conclusion
The big difference between Head & Shoulders and Quasimodo – both are reversal patterns, but the Quasimodo has a deeper pullback. A lower low form before a trend reversal.
You are welcome to follow us on our trading rooms and our webinars where we show this in-depth and many live examples, which are always better to show.
up for our Newsletter.
Subscribe to our youtube channel.
Click here to check how to get qualified.
Click here to check our funding programs.


