
Stochastic Oscillator Indicator
Forex is a very exciting platform for trading for both traders and investors. However, just like every market, forex has its own risks.
That’s why forex traders love indicators, which help them to read the market and enter & exit positions.
In this article, we will explain about the stochastic oscillator indicator and how you can combine it with your trading strategy.
What is a Stochastic Oscillator?
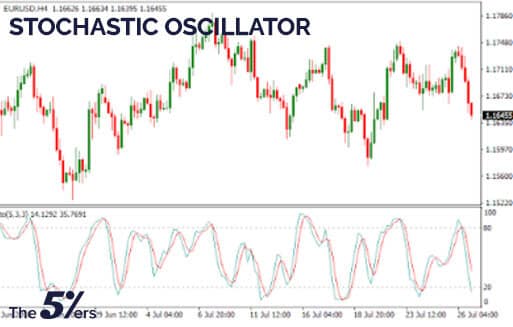
This momentum indicator considers the current closing price of a security in relation to a high-low range of prices over a set number of look-back periods. This oscillator can be very useful when used in tandem with your candlestick charts.
In addition to its usefulness as an indicator of momentum, the stochastic oscillator may also be used as an overbought or oversold indicator when readings are at extreme levels: 30 percent for oversold and 70 percent for overbought.
In other words, Oscillators are mathematical equations that are graphed onto price charts so you can more easily decide whether the price action is a correction in an ongoing trend or a change in the overall trend. Oscillators usually are graphed above or below the price charts.
What is The Formula of a Stochastic Oscillator?
George Lane developed the stochastic oscillator in the late 1950s. The formula behind it is pretty remarkable for an indicator that is 50 years old. There are actually two readings for a stochastic oscillator that are combined on a chart. They’re referred to as the slow (%D) and the fast (%K) stochastics. The slow one is generally a moving average of the fast one. The formulas for the slow and fast stochastic oscillators are as follows:
Fast Stochastics:
%K = 100 × (Recent Close – Lowest Low(n) ÷ Highest High(n) – Lowest Low(n))
N = number of periods used in the calculation.
Slow Stochastics:
%D = 3-period moving average of %K
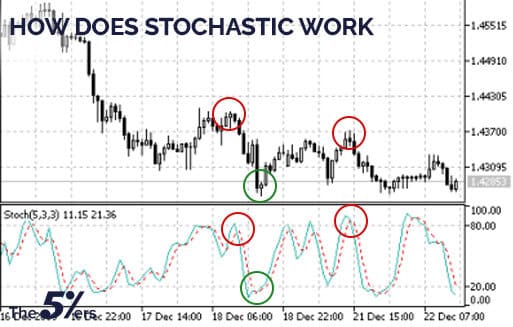
How Does Stochastic Work?
A stochastic indicator is a great tool for identifying overbought and oversold conditions over a specific time period.
The stochastic oscillator is preferred by many traders when the price is trading in a range because the price itself is ‘oscillating,’ leading to more reliable signals from the stochastic indicator. However, traders need to avoid blindly shorting at overbought levels in upward trending markets; and going long in down trending markets purely based on oversold conditions shown by the indicator.
Price is shown to be ‘overbought’ when the two moving lines break above the upper horizontal line and ‘oversold’ once they break below the lower horizontal line.
The overbought line represents price levels that fit into the top 80% of the recent price range (high – low) over a defined period – with the default period often being ‘14’. Likewise, the oversold line represents price levels that fit into the bottom 20% of the recent price range.
Timing entries
Furthermore, the stochastic indicator provides great insight when timing entries. When both lines are above the ‘overbought’ line (80), and the %K line crosses below the dotted %D line, this is viewed as a possible entry signal to go short and vice versa when the %K line crosses above the %D line when both lines are below the oversold line (20).
Additionally, traders should not blindly trade based on overbought/oversold conditions alone. Traders need to understand the direction of the overall trend and filter trades accordingly.
For example, when looking at the USD/SGD chart below, since the overall trend is down, traders should only look for short entry signals at overbought levels. Only when the trend reverses or a trading range is well-established should traders look for long entries in oversold conditions.
Bullish and Bearish Divergences:
The most common use of the stochastic oscillator is to identify bullish and bearish divergences points at which the oscillator and market price show different signals as these are normally indications that a reversal is imminent.
A bullish divergence occurs when the price records a lower low, but the stochastic oscillator forms a higher low. This shows that there is less downward momentum and could indicate a bullish reversal.
A bearish divergence forms when the market price reaches higher highs, but the stochastic oscillator forms a lower high. This indicates declining upward momentum and a bearish reversal.
However, it is always important to remember that overbought and oversold readings are not completely accurate reversal indications. The stochastic oscillator might show that the market is overbought, but the asset could remain in a strong uptrend if there is sustained buying pressure. This is often seen during market bubbles periods of increased speculation that cause an asset’s price to reach consistently higher highs.
This is why it’s vital for anyone using the stochastic oscillator to combine the readings with other technical analysis indicators and a comprehensive risk management strategy.
Bull and bear set-ups
A bull set-up is the opposite of a bullish divergence. It occurs when the market price forms a lower high, but the stochastic oscillator reaches a higher high. Even though the asset itself did not reach a new high, the optimism from the indicator is a sign that the upward momentum is strengthening.
A bear set-up is the inverse of a bearish divergence. It happens when the market price forms a higher low, but the stochastic oscillator falls to a lower low. Even though the asset held its price, the indicator shows there is increasing downward momentum.
Stochastic Oscillator vs. RSI
The stochastic oscillator and relative strength index (RSI) is both momentum oscillators, which are used to generate overbought and oversold signals.
Despite both being used for similar purposes to identify price trends, they are based on very different theories. The stochastic oscillator is based on the idea that those closing prices will remain near historical closing prices, while the RSI tracks the speed of the trend.
Both oscillators work on a zero to 100 scale, but their signals also vary. The RSI would indicate the market is overbought if it reaches above 70, while the stochastic oscillator would need to reach 80. And the RSI would consider the underlying asset undersold if the indicator was below 30, while the stochastic oscillator would need to fall to 20.
Stochastic Oscillator Summary
The stochastic oscillator is a momentum indicator, which compares the most recent closing price relative to the previous trading range over a certain period.
It is a leading indicator, as it’s based on the idea that market momentum will change direction much faster than volume or price increases.
The most common use of the stochastic oscillator is to identify bullish and bearish divergences points at which the oscillator and market price show different signals.
It can also be used to identify bull and bear set-ups, points that indicate increasing momentum in the opposite direction.
It is often likened to the relative strength index (RSI), another momentum indicator. However, the RSI is based on the speed of changing prices rather than historical prices.


