Andrews Pitchfork’s strategy
Alan Andrews has invented the Andrews’ pitchfork strategy. This pitchfork is a technical indicator consisting of 3 parallel trendlines (Median line, upper trendline, lower trendline). Andrews’ pitchfork is drawn, using one of the below methods:
* low-high-low
* high-low-high
This indicator is used to identify the possible location of supports/resistances as well as breakout levels. Three trendlines are drawn by choosing 3 points (start point of uptrend/downtrend). When the location of points has been specified, the median line is drawn from point “A,” and the lower and upper trendlines are drawn parallel to the first line from points “C” and “B.”
Drawing Andrews’ pitchfork, using Awesome oscillator
Now, we shall discuss how the location of these three points is determined. Three pivot points are needed to draw the Andrews’ pitchfork. The term “reversing” refers to points in which the market trend reverses. These points can be easily found on the chart. Dr. Andrews used the important price breakouts to find these points. But we could use the Bill Williams AO indicator to be sure. We shall proceed as illustrated in the below figure:

After choosing Awesome Oscillator, the below window will open, which requires you to choose your desired colors:

Finding pivot points via the AO indicator
After adding the AO indicator to the chart, we look at phases and AO variations to find the pivot points. This oscillator consists of a negative phase and a positive phase, which are used to measure the market movements and to confirm trends or predicting reverses.

It is observed in the above figure that, in each positive or negative phase, there is a high/low. The high/low points in which the market has reversed could be found with the AO indicator and used to draw Andrews’ Pitchfork.

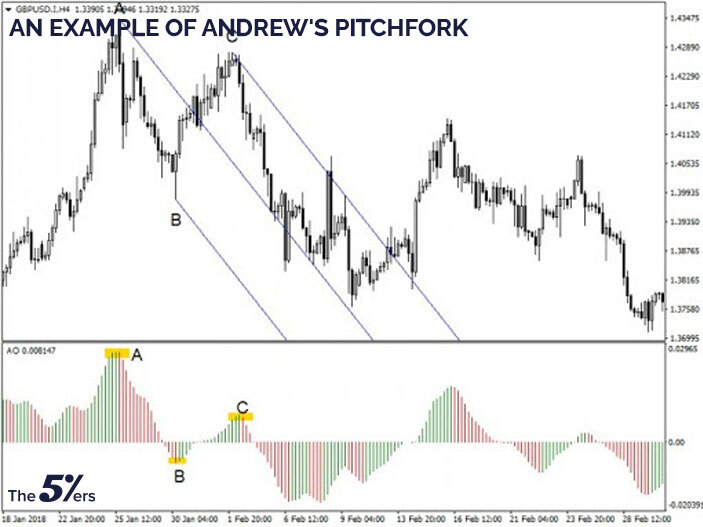
According to that is observed in the above figure that, in each positive or negative phase, there is a high/low. The high/low points in which the market has reversed could be found with the AO indicator and used to draw Andrews’ Pitchfork. In the above chart, “A,” B,” and “C” are found to draw Andrews Pitchfork. To draw Andrews Pitchfork, you can choose it below the “Insert” menu.

After specifying the location of pivot points via the AO indicator, we shall choose “Andrews’ Pitchfork” from the “Insert” menu. After that, we shall proceed by clicking on “A,” “B,” and “C,” respectively, for the Pitchfork to be drawn. An example of Andrews’ Pitchfork is shown in the 4-hour GBPUSD chart below.

As you can see in the above chart, after adding the pitchfork, the GBPUSD pair has bounced on the middle support and moved towards the upper trendline.
After drawing Andrews’ Pitchfork, it’s time to draw the trigger line. The trigger line is drawn from “A” to “B” or “C” and is extended from there. We shall wait for the pitchfork to break before we draw the trigger line. In the above chart, the upper trendline is broken. Therefore we draw the new trendline from “A” to “C.” The trigger line helps us identify the next price targets after the pitchfork’s breakout.

In the 4-hour GBPUSD chart, after drawing the descending pitchfork, the price has broken the upper trendline and moved towards the trigger line.
Always remember that in a descending pitchfork, the upper trendline and trigger line is more important.
What is the median line of the pitchfork?
The median line is the bisector of the channel. The pitchfork’s median line acts as an important supporting/resisting area, and also pivot points occur around them. If the median line is broken downwards, the next target would be the lower trendline, and if it breaks upwards, the next target would be at the upper trendline.

In the weekly EURNZD chart, it is illustrated that the median line has acted as a resistance and guided the price towards the lower trendline.
Another method to draw Andrews’ Pitchfork strategy is to draw the median line first. In this method, you shall draw the median support/resistance and then draw the two trendlines parallel to the first one. The latter trendlines shall act as supports and resistances too.

According to the above figure, the resisting line had drawn from the high in 2015 to the high in 2016. A trendline has been drawn parallel to this resistance from the low in 2016. The second trendline has acted as a support.
Using parallel lines could help the trader to find entry/exit points.

In the above example, although the AUDUSD pair is fluctuating between two parallel lines, but if a median line is drawn between them, it can be seen that the price has responded to the median line too.
Andrews’ Pitchfork principles
Here are Andrews’ main principles:
* Price will mostly (more than 80% of the time) touch the median line of the pitchfork.
* Price will mostly change direction when touching the median line of the pitchfork.
* Price can touch the median line more than once, usually causing fluctuations.
* If the price hasn’t been able to touch the median line (20% of the time), the market intends to form a bigger wave in the opposite direction, i.e., if the market has formed an ascending pitchfork but hasn’t touched the median line, it is probable that a descending rally begins in the market.
When does the price reach the median line?
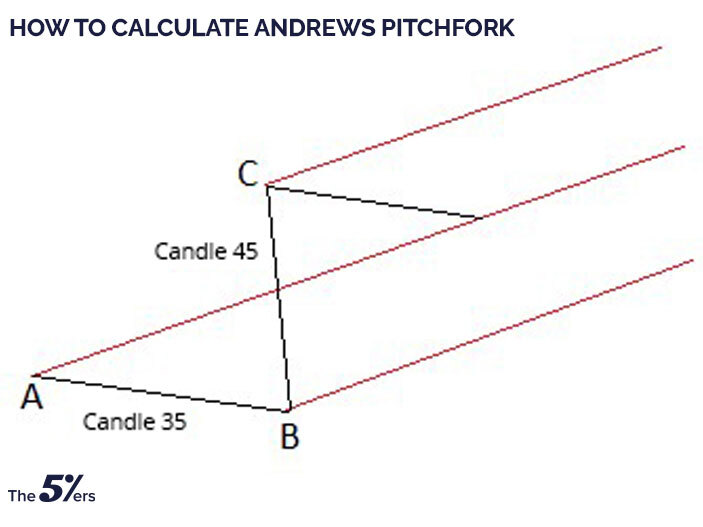
Imagine that we have drawn Andrews’ Pitchfork using three pivot points. The time needed for the price to reach the median line from the third point can be calculated using the below method:
Count the number of candles between the first and second points and between the second and third points. The larger number is chosen as the time needed for the price to reach the median line from the third point.

As an example, in the above figure, there are 35 candles between points A and B, and there are 40 candles between B and C. Since 40 is the larger number, it is expected to take 40 candles for the price to reach the median line.
If the price hadn’t reached the median line within the specified period, we might conclude that the market isn’t in a stable condition. Therefore, we shall wait until the trend is formed and then decide to enter the market.
Pitchfork’s trading signals
- The market has reached the median line and has formed reversing candles as a result. If the RSI indicator shows buy/sell saturation at this exact moment, a buy/sell position could be taken.
- Market reaches the median line and bounces up/down towards the upper or lower trendline, and one of these trendlines will break as a result of this movement. A sell or buy position could be taken in this situation.
- Market reaches the median line and bounces up/down towards the upper or lower trendline but isn’t able to break the trendline and keeps fluctuating in the pitchfork. For example, price touches the lower trendline and bounces back up, and this is a good opportunity to go long and specify your TP somewhere around the median line.
- If the market never reaches the median line, we shall wait to see whether the lower or upper trendline breaks along with the trigger line. In this case, a trading signal is generated.

In the 4-hour AUDUSD chart, it is observed that the market hasn’t reached the median line. Therefore the lower trendline and trigger line is broken, and a downtrend has formed.
Andrews’ pitchfork strategy summary
You got acquainted with Andrews’ pitchfork strategy in this article through several practical examples. You can use this strategy efficiently, even if you have just basic knowledge about technical analysis and know your way around a tradingplatform such as MetaTrader.
If you want to receive an invitation to our live webinars, trading ideas, trading strategy, and high-quality forex articles, sign up for our Newsletter.
Subscribe to our youtube channel.


