
Intraday Forex Chart Patterns
Trading forex chart patterns intraday has the potential to be very lucrative and rewarding.
I’ve communicated with a lot of experienced intraday traders who analyze the market and predict price movements using chart patterns and price action trading.
To be profitable, intraday trading requires accuracy and a trading edge or a probability of winning that is in your favor.
We’ll take a close look at intraday forex chart patterns based on these two key elements in this article, and I’ll show you the top 5 intraday forex chart patterns for successful trading.
But first, let us look at the fundamentals of intraday trading with forex chart patterns.
Forex Intraday Trading With Chart Patterns
Before you begin using intraday forex chart patterns, make a note of the following fundamental intraday trading key points.
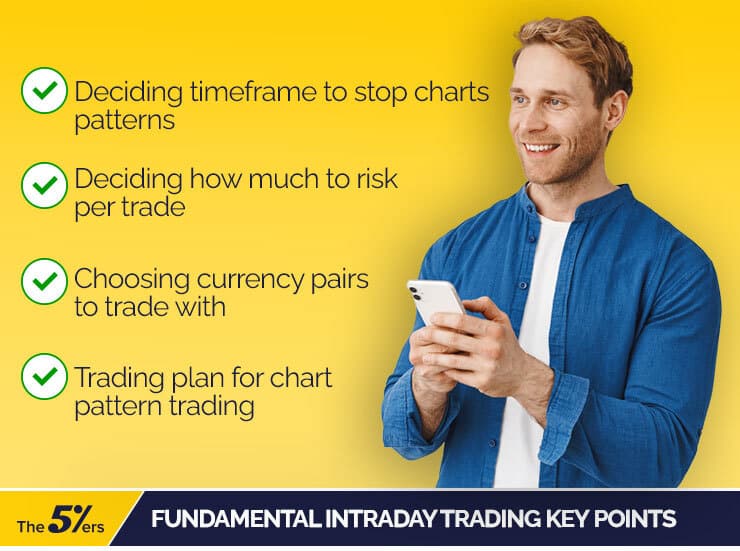
- For intraday forex trading, you can use 5-minute, 10-minute, and 15-minute time frames; the important thing is to stick to one timeframe while observing chart patterns. However, higher time frames can be used to spot trendlines and support and resistance to take advantage of important levels.
- Money management comes next; without a proper money management plan, it is very easy to blow an account while intraday trading in forex. Because of the high leverage, an optimum lot size calculation is required; as a general rule of thumb, you should not risk more than 2% of total capital on each trade.
- Following that, choose currency pairs with good liquidity and stick with one or two currency pairs at first. As your skills in spotting and trading chart patterns improve, you can expand your trading to other pairs as well.
- “Plan your trades and trade your plan,” as you may have heard before. This could not be more crucial for trading intraday forex chart patterns. You must have a strategy prepared for each chart pattern we will cover here, and you must have the answers to some key questions before you can place a trade, such as when to enter, what the target is, when should I exit, and where should I set my stop loss?
Once you’ve figured out the above points, we can move on to learning about the best forex chart patterns for intraday trading –
Top 5 Day Trading Forex Chart Patterns
Here are the top chart patterns for interday traders
1. Flag Pattern
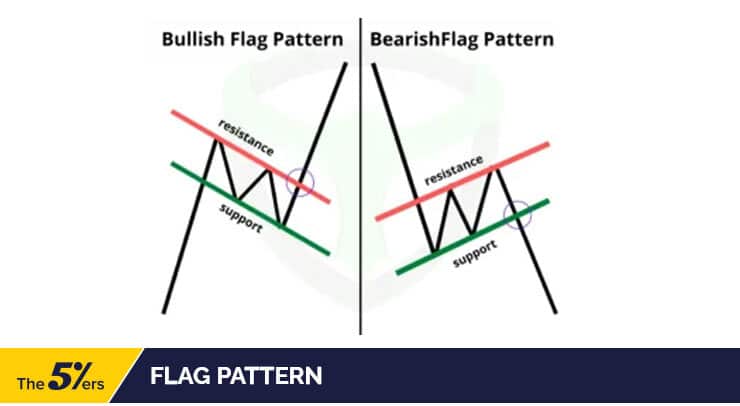
Why should the flag chart pattern be at the top of the list?
Well, the pattern that is so easy to spot, so common during strong trends, has a very good risk-reward ratio and is so simple to trade.
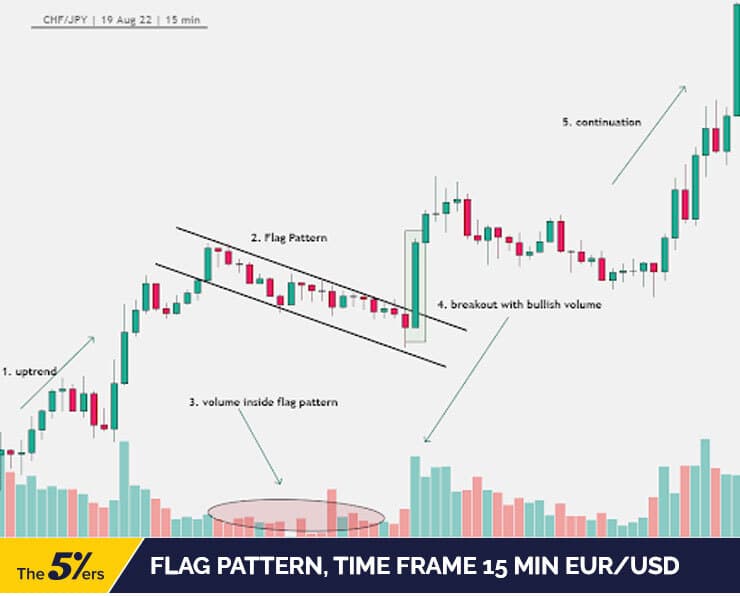
An Example of a Flag Chart Pattern for intraday forex trading –
Take note of the following tips to trade flags effectively.
Pro Tips for trading flags
- Use any trading structure to confirm the trend, such as support and resistance in the above example or trend lines, and then spot the trend and always trade in the trend’s direction.
- Wait for flag patterns to fully appear before entering a trade; the tighter the congestion, the better the reliability and risk-to-reward.
- It has been my observation that volume tends to fall during the formation of flag chart patterns; if this occurs, it is a good sign and should be interpreted as an extra confluence.
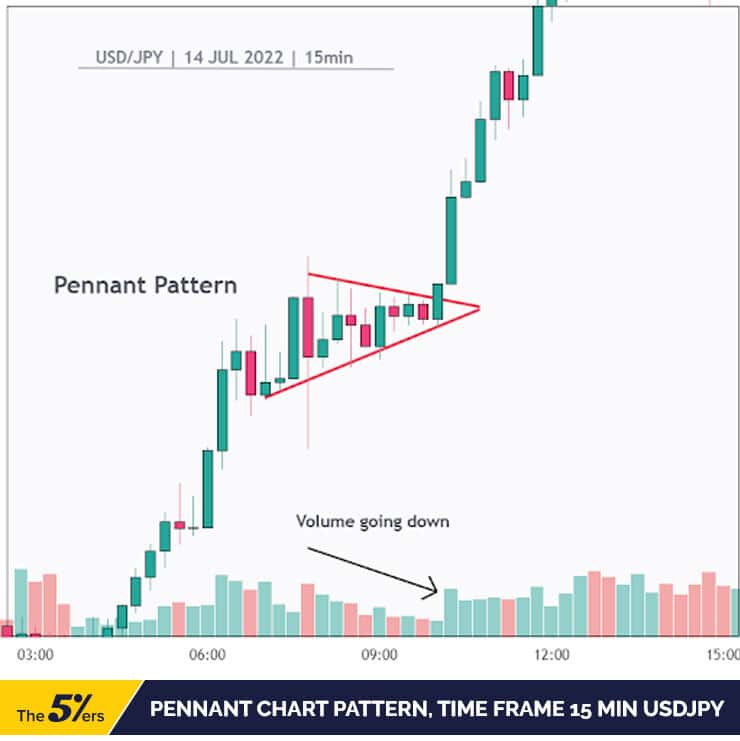
2. Pennant Pattern
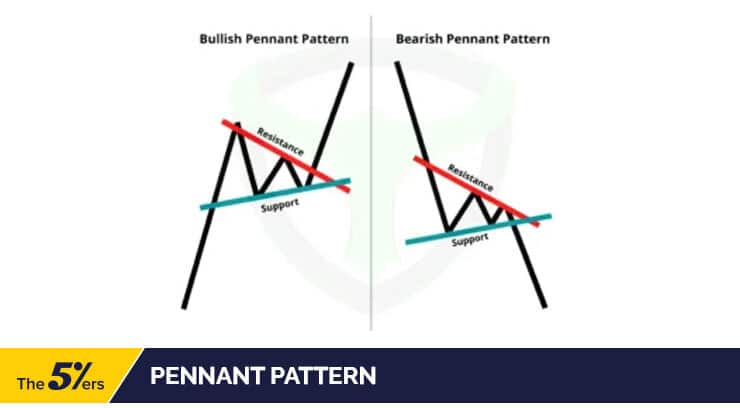
As one of the best forex chart patterns, the pennant pattern has applications in intraday trading that are very similar to those of the flag pattern. However, because pennants occur more frequently than flags, it can be challenging to distinguish a pennant from a regular congestion.
An Example of a Pennant chart pattern:

You can improve your trading performance and increase your chances of winning by using the following tips while trading Pennant for intraday forex trading.
Pro Tips for trading Pennants
- As shown in the preceding example, in the case of pennants, volume tends to decrease while the pattern forms and then increase after the valid breakout; use this as a hint and trade with the volume indicator to get the most out of a trade.
- Pennants offer an excellent risk-reward ratio due to their tight stop loss. Typically, a valid stop loss is placed at the opposite end of the trendlines that form the pattern; however, take volatility into account as sharp spikes can hit many stops before the price eventually moves in the direction of the trend.
- If a pennant pattern forms after a long extended trading range, it should be treated as a top priority.
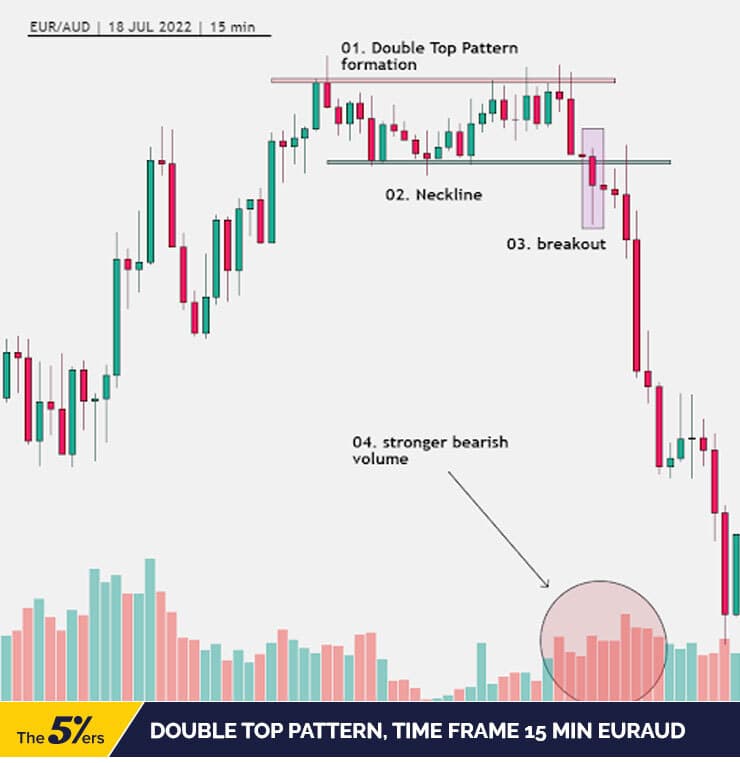
3. Double Top Pattern
A double top is a bearish reversal pattern and is considered one of the most popular chart patterns among traders because of its frequent appearance. It can be identified in any time frame and is easy to spot. A trader simply has to figure out two equal tops of the market to identify this pattern.
Here’s an illustration of a double-top chart pattern:
Tips for Trading Double Top
- On up-trending markets, the formation of a double-top pattern can be seen.
- It can be identified when the market forms two equal highs.
- The lowest level (as shown in the figure) between two equal highs can be used as a neckline or support level.
- Once the price breakthrough this support level, a high probability of bearish momentum will be seen
- The height of the double top’s formation can be used as a price target level.
- To manage the risk, a trader can place the stop loss level above the top of the formation.
4. Double Bottom Pattern
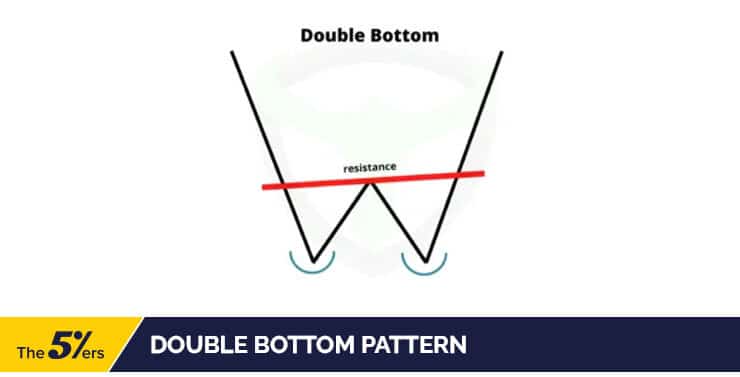
This pattern, which is the opposite of the Double Top pattern, typically forms close to downtrends. The Double Bottom is a bullish reversal pattern. They are also easy to identify due to their similar personalities.
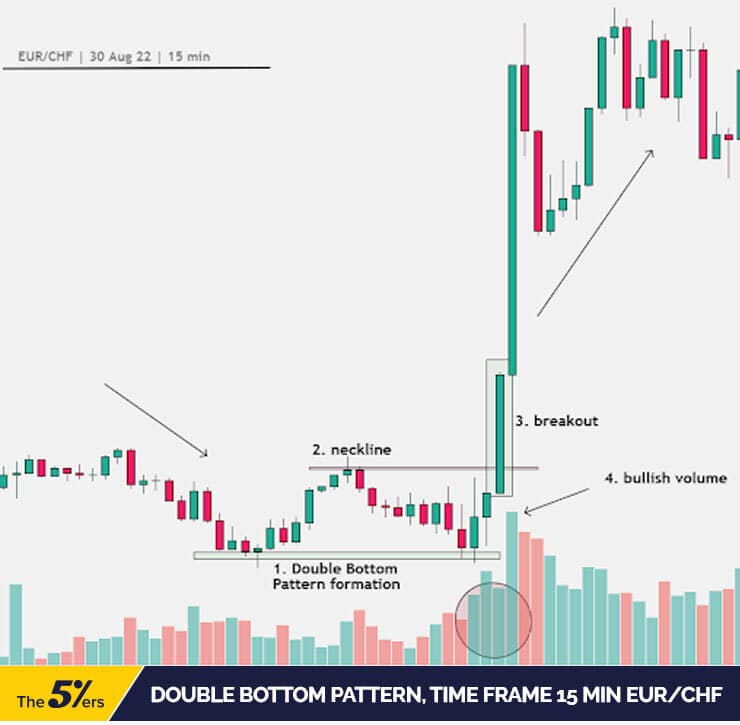
The Double Bottom pattern is formed when the price forms two equal lows, signaling the weakness of bearish momentum in the market.
Here’s an example of a Double Top Chart Pattern:
Tips for trading Double Bottom
- Two equal lows are required to identify a double bottom formation. To confirm the pattern, the price must break and close above the neckline (resistance).
- A trader can place a long entry once the candlestick closes beyond the neckline.
- The price target would be equal to the height of the pattern.
- A stop loss should be placed below the bottom of the formation, as with the Double top pattern.
5. Rectangle Patterns
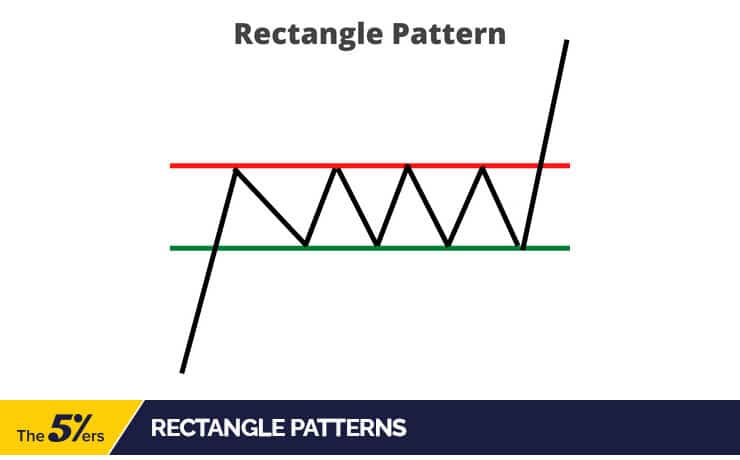
Rectangle patterns, like Flag and Pennant patterns, are quite common in trending markets. They represent a market consolidation phase that occurs between two parallel horizontal levels.
Take a look at this example:
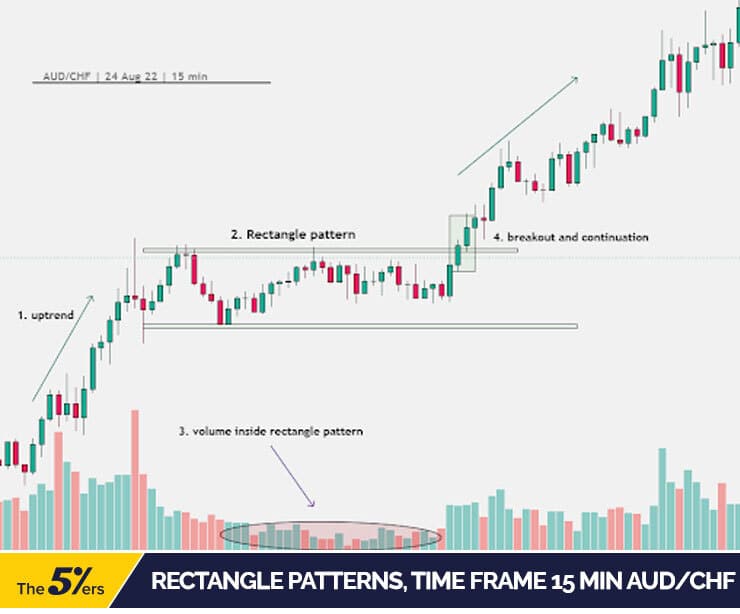
Pro Tips for trading Rectangle Pattern
- When the rectangle pattern appears, keep an eye on the previous trend.
- To confirm the breakout of the rectangle pattern, wait for the candlestick to close beyond the pattern.
- Outside the rectangle, an entry can be placed after the candlestick’s body has been closed.
- The price target would be the height of the rectangle’s pattern. And the stop loss should be placed above (for a short entry) or below (for a long entry) the body of the rectangle.
Key Takeaways
- To be a successful intraday trader, you must have an edge and accuracy in identifying and executing price action chart patterns.
- You can use 10-minute or 15-minute candlestick charts to get the best chart patterns for intraday trading.
- Although chart patterns in intraday trading do offer very good trading opportunities, perfecting their use requires a lot of practice, the right mindset, and sound trading psychology.
- Money management is a critical aspect of intraday forex trading; you should plan ahead of time how much to risk; as a general rule, risk per trade should not exceed 2% of total capital.
- Flag, pennants, double top, double bottom, and rectangles are the five most popular intraday forex chart patterns.
- Volume bars combined with chart patterns are an excellent supporting indicator for intraday chart pattern trading.
👉 If you want to receive an invitation to our live webinars, trading ideas, trading strategy, and high-quality forex articles, sign up for our Newsletter.
👉 Click here to check our funding programs.


