
Market Trends: Definition, Detrmaing, and Types
A market trend analysis is a technical analysis tool based on studying indicators, barriers, and market patterns to forecast future prices. Furthermore, market trend analysis requires reviews of previous and present market statistics data to predict future market trends.
Three Primary Directions
The market trend has three primary directions: bull trend, bear trend, and sideways market. These three recurring categories determine market behavior for a given asset or pair over time. Furthermore, trends are classified into primary, intermediate, and minor categories.
The following paragraphs cover all of the previously listed topics in detail. Keep reading to get a better understanding of market trends.
What is a market trend? How do we determine market trends? And how do you use them to your advantage? What are the market trend types and their lengths?
Market Trend Definition
A market trend in the forex and stock markets is a price move in a particular direction over time for a specific asset or pair.
The Use of Trend Lines for Determining Market Directions
Drawing trendlines is the most effective method of determining market trends. Meanwhile, mastering the art of trendline drawing does not require a high level of proficiency. Therefore, we will use trendlines in a specific way for each of the three main market directions. Starting with an upward direction.
Drawing Trend Line for Upside Direction
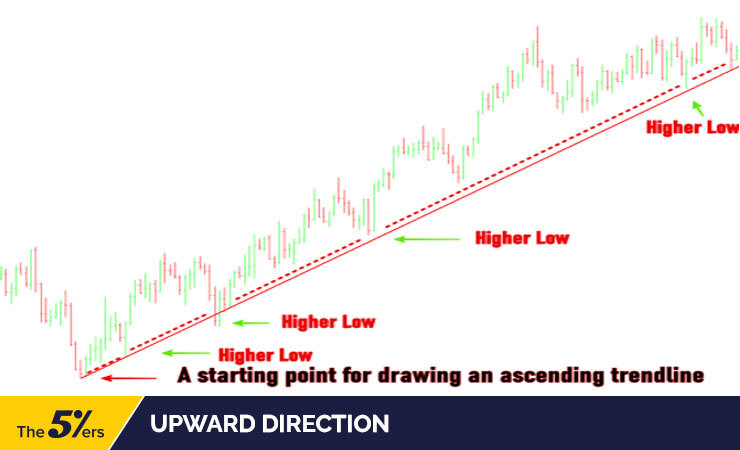
In an upward direction, traders draw an ascending trendline below the price. Using the last bottom as a starting point for the trendline. Furthermore, the trendline will support the upward price direction. Since the trendline performs as support, it must connect a series of higher lows.
We’ll look at the AUD/USD pair’s trading behavior between September 29th and October 29th, 2021, to demonstrate how to draw an ascending trendline in an upward market.
The graph below shows that the ascending trendline connects the higher lows with the higher lows. The price of an asset or currency pair should keep rising until it closes below the recently created support “trendline.”
Downward Direction
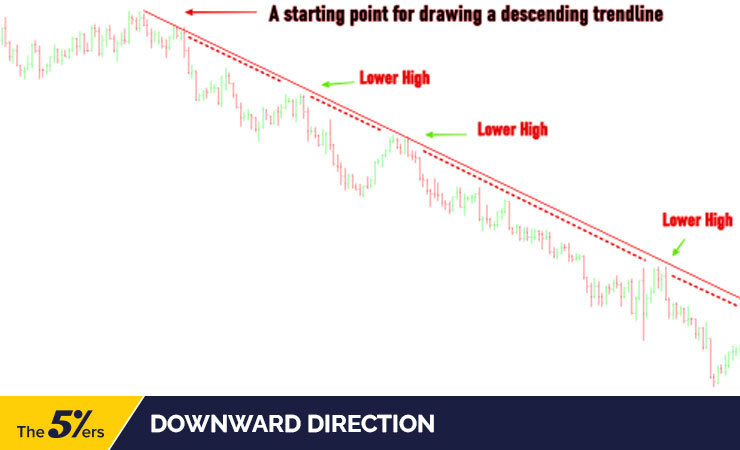
In a downward market, the descending trendline helps define market direction. In this scenario, the descending trendline must touch all lower highs and act as resistance; additionally, the resistance prevents the price from making new higher highs. There is no doubt about it, but traders must draw a descending trendline above the price and connect the series of lower highs. The last price peak should be the starting point for the trendline.
To explain how to draw a descending trendline in a downward market, we will examine the trading activity of the AUD/USD pair between October 29th and December 7th, 2021.
The below graph shows that the descending trendline connects the lower highs pecks. Trades should expect an asset’s or currency pair’s price to continue to fall until it closes above the recently formed resistance “trendline.”
Sideways Market Direction
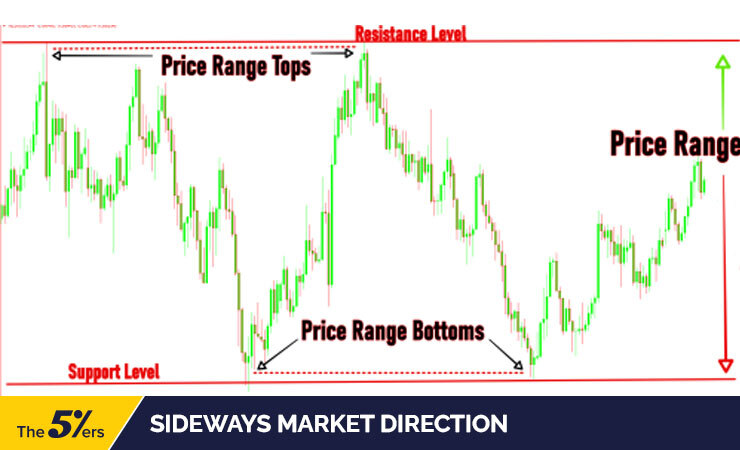
The last scenario requires two trendlines. Speaking of the sideways market, in this case, the market moves in a horizontal narrow range for an extended time, which results in a tumble from a specific high level and a rebound from a specific low level. Consequently, the trader needs to draw two horizontal lines, one above the market price and another below the market price, which serve as resistance and support. For clarity, the support level must connect with all bottoms, while the resistance level must connect with all edges.
Additional explanations for the NZD/USD pairs are included in the graph below. Two horizontal trendlines act as resistance and support. The resistance connects price peaks, while the support connects price bottoms. Therefore, the price of an asset or currency pair remains range-bound until it closes above or below the previously drawn “trendlines” of support and resistance.
Market Trends and the Length of Each Type
The market trend may last days, weeks, or even years, depending on the intensity of the trend. On the other hand, the three main types are primary, intermediate, and minor. The duration of the trend characterizes the market trend type. Below, you’ll find more details and examples of the various types of existing markets.
Primary market trend
Defining a market trend as primary must last for several months to a year and may last for many years. A strong economy can be in a long-term bull market lasting from a year to decades.
Intermediatemarket trend
The medium market takes its position as a secondary market trend. The medium market trend could last from a few weeks to several months. As a result, it’s known as a “correction of the primary trend.” Also, some big data releases, changes in financial policy, and panic could put the intermediate trend in the spotlight.
Minor market trend
The shortest-lived trend is the minor trend, which moves in a particular direction for a short time. It can last from a day to a few weeks.
Market Trend Example
Trends may result from a data release, a political decision, a central bank release, or other reasons that cause uncertainty in the market.
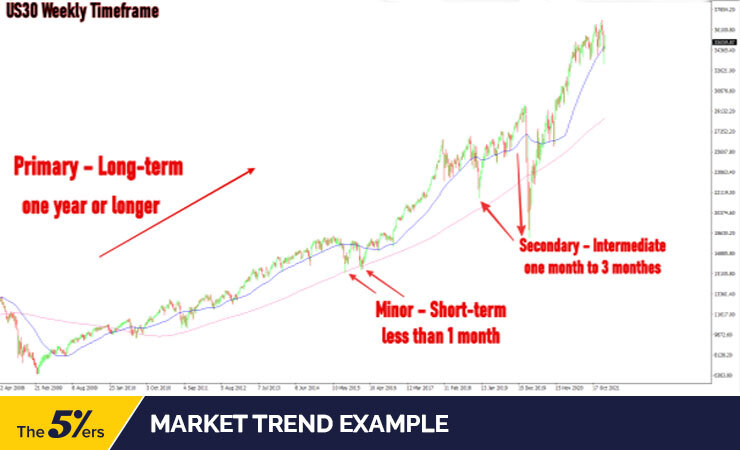
To illustrate the three market types and the length of each type in-depth, we will analyze the US 30 Index’s trading activities from February 2009 to the present.
For the last 12 years, the primary trend has been upward, as shown in the chart below. The medium type occurs occasionally and is more frequent in price corrections. The medium trend lasts from weeks to months. However, the minor trend appears more prominently due to the shorter duration. As we mentioned, it lasts from days to weeks.
Please note that each candlestick represents the price start and end of the five weekly trading days, from Monday to Friday.
Market Trend Summary
Those pieces of information mentioned help you figure out what trends are going on in the market and which one would be best for you to take advantage of.
These trends and patterns persist across all time frames, providing an opportunity for both short-term and long-term traders to profit from them and long-term investors who keep their stock shares for years. Hopefully, you found the information in this post valuable enough to apply it to your advantage.


