
Gartley Butterfly Pattern
Initially, the gartley butterfly pattern was perceived as an ideal figure, which is rarely used in practice. But in addition to the classical version, over time, similar harmonic models were discovered like “shark”, “crab”, “bat.”
To accurately apply various technical indicators in practice, you need to understand the setups on the charts and effective trading methods.
What is the Gartley butterfly pattern?
This Gartley butterfly pattern was discovered by Harold M. when he was the founder of the organization of stock analysts in New York. He was an experienced trader, a good educator, and a financial advisor. He published his ideas for planning patterns in the collection “Profits in The Stock Market” back in 1935.
According to the theory, the Gartley butterfly is a pattern that is used in trading to analyze charts and fix the subsequent value. So Gartley patterns are considered independent corrective patterns that reflect the continuation of a current trend. In this case, the primary trend temporarily changes its usual direction before returning to the initial movement.

A little later, his developments were supplemented by S.M. Carney and L. Pesavento. The original model, which previously relied on Elliott waves, is now based on the sequence of the Fibonacci number series and its “golden ratio”. So the version from Gartley is now the oldest analog when other harmonic patterns turn out to be just a modification.
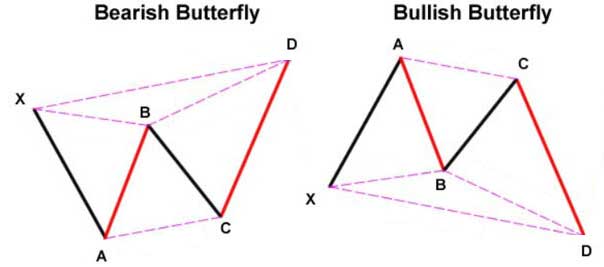
The pattern is formed at the final rollback point, which allows the Forex traders to immediately take the appropriate steps as part of the further market change and enter the deal at the most favorable price:
- A is about 61.8% of the previous XA movement.
- The BC length is represented by 38.1%, 50%, 61.7%, 78% or 88.6% of the AB wave.
- The CD line reaches 127%, 161.8%, or ends at 78.6% of XA.
How to trade the Gartley Butterfly pattern?
This pattern is a reversal duplicate that allows you to trade at large-scale extremes within the selected timeframe in the form of 2 variations – a bull and a bear.
For successful trading, you should focus on the following algorithm of actions:
Determine the breaking hour of the completed trend that sets the tone for the XAB pattern.
Check the AB correction ratio of 78.6% concerning XA.
Make sure that the next intervention falls within 38.2% – 88.6% of the AB length.
Mark an extension of 127.2% of the XA correction, where point D will emerge (the point itself must remain in the area of 161.8% – 261.8% of BC).
Place an order at 127.2% of XA, where the stop-loss includes at least 1/10 of the next target.

Immediately after the natural impulse, a correction occurs, presented in the form of 3 waves, and in parallel with creating a formation according to Gartley’s theory, the market returns to a typical trend and reaches a new bottom or peak.
In practice, the pattern is profitable when it occurs in the direction of the current trend.
Principle of Butterfly Analysis
The interpretation of the scheme from Gartley is explained by the fact that harmonic patterns are worked out according to a single principle, with a clear number of percentages of probability. This is directly related to the stereotyped behavior of market participants.
Therefore, most experienced traders do not advise using analysis on timeframes below H1. The behavioral nature of other people is well manifested over a long period. On a limited scale, participants, first of all, come across a lot of small money, and on large timeframes, units of large analogs are better visible.
Calculation principle
To build harmonic schemes, it is necessary to consider the order of the Fibonacci numbers. When dividing any number from the standard series by the previous number, the total amount logically tends to 1.618. Further, it is necessary to understand how these levels appeared with such numbers for the Gartley indicator butterfly.

From 0 to 100, 100% of the distance is counted, and if you divide this by 1.618, you get 61.8%. Then 61.8 / 1.62 = 38.2%, and 38.2 / 1.62 = 23.6%. But considering that 50% does not apply to the list of Fibonacci numbers, it should be taken as the symmetry of the instrument.
Construction principle
The most significant requirement for all harmonic models is the “AB = CD” rule:
- The first segment must correspond to the established CD length.
- To start fixing the pattern, it is worth connecting the XA line with the Fibonacci tool, stretching it from right to left.
When the trend reverses, you need to connect the extremes with the “triangle” tool, fixing points X, A, B (61.8%), while point C remains at the level of 23.6% from the start of the 2nd wing. Based on the requirements of the model, the optimal distance for a simple entry into a position will be the zone from 23.6% to 38.2%.

Trade using the Gartley pattern
Being in the interval between the levels of 23.6% and 38.2%, you can set a stop loss at the low price beyond the fixed boundaries of the low price.
With a profit target, the scheme is different:
- Point B is located almost near 61.8%.
- The classic traders can set the first option at 78.6%, and the second at 88.6%.
- But more daring, desperate, or just gambling market participants can set the initial value of 88.6% and the second one for it.
All analysis and harmonic patterns of Gartley are reduced to the mission of picking up the CD segment upon arrival.
Placement of stop loss and take profit.
Take profit should be fixed at the level where point A was formed earlier. The place where the take profit is set when trading with the butterfly pattern is subjective and interconnected with the selected targets and market conditions. The aggressive variant is set at point A, and the more conservative analog – in zone B.

Stop-loss in a trading strategy, where patterns are involved should be placed above D in a downtrend and below point D in the opposite pattern. You need to try to move it to breakeven in the shortest possible time. At the same time, the amount of potential risk per trade should not exceed 1.5%.
Other types of Gartley patterns
To understand the signals from the Gartley butterfly patterns, you need to study their other varieties.
Now the following types are distinguished:
Bat. The most common type of butterfly, which differs in other ratios between the wings of the graph. A special feature is the increased length of the CD segment in the AB = CD pattern. Here, at the entrance, stop-loss is above point N with a margin.
Crab. It is distinguished by an even longer CD knee. It can exceed the AB segment by 2-3 times in size. Here, a fixed stop loss is used, and the entry takes place through a pending order or at the market price.
Shark. It is a robust Forex chart model rooted in harmonious trading. It is customary to define it at the expense of Fibonacci levels since the followers of the considered type attach special importance to these levels.
Many variations require continuous monitoring. It is important to monitor risks and comply with money management rules.
Model pros
The main advantage of the analysis is that all data on it is presented as accurately as possible: a clear level, a segment, and a point of probable price stopping. The Gartley pattern suggests where to take profit.
The second advantage is the reliability of working out the models (like point D). You can always play it safe and stretch the Fibonacci extension into two segments (XA and BC) and, with a high coincidence of levels from both Fibo grids, increase the number of trading opportunities.
Model cons
Like any type of analysis on charts, the interpretation and application of harmonic Gartley patterns have a flaw; the variety of options available is too great. Such a large number of patterns confuses traders, which often leads to financial losses. Secondly, it’s not necessary that market will halt or reverse from a certain Fibonacci retracement level. So there can be false trading signals as well that you may need to filter out using any confirmation analysis tool.
Gartley Butterfly Pattern Summary
The Gartley Butterfly pattern is quite famous for its accuracy and tendency to mark the future projection of price. However, the pattern is not commonly seen and could be complex for beginners. Like many other tools and strategies, the Gartley Butterfly pattern has some pros and cons. Proper placement of Fibonacci extension lines may help the traders to find trading opportunities within the pattern and after the pattern completion. However, the negative aspect of it is the subjectivity in the pattern.
up for our Newsletter.
Subscribe to our YouTube channel.


